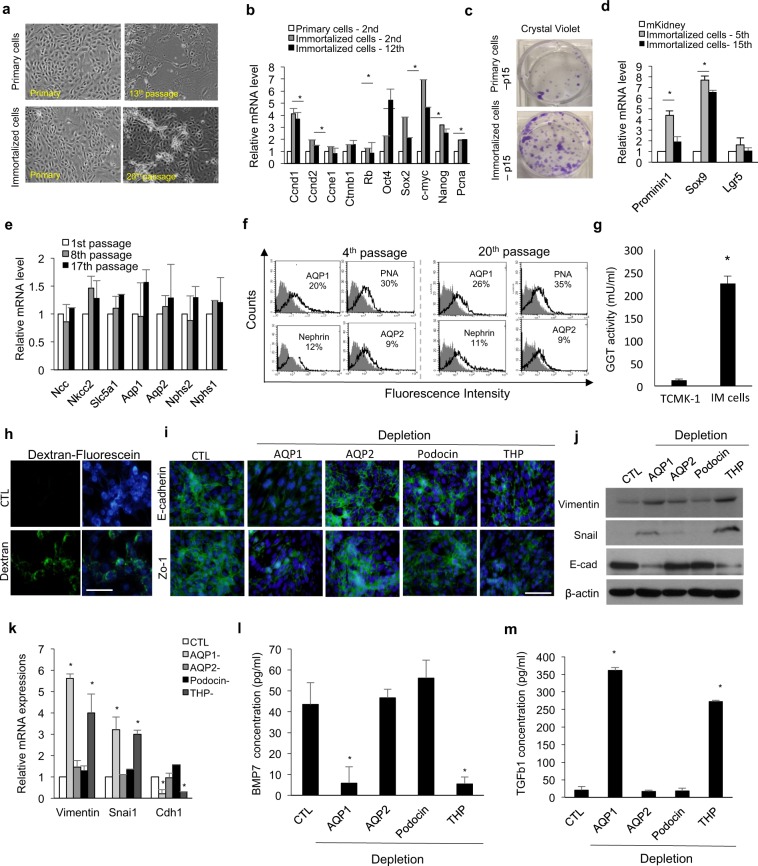
Figure 1.
Establishment and characterization of primary renal cell lines from mouse. (a) Morphology of mouse tubular epithelial cells during in vitro culture. (b) Quantitative RT-PCR analysis of proliferation markers related to or downstream targets of hTERT and SV40 gene. n = 4 for primary cells at the 2nd passage, immortalized cells at the 2nd passage, and immortalized cells at the 12th passage, respectively. (c) Crystal violet staining of primary cells and immortalized cells after the 15th passage. (d) Relative mRNA expression of Prominin1, Sox9, and Lgr5 in the immortalized cells at the 5th and 15th passages compared to that in mouse kidney lysate (mKidney). n = 4 for immortalized cells at the 5th and 15th passages, respectively, and n = 3 for mouse kidney lysates. (e) Quantitative RT-PCR analysis of kidney-specific segment markers in mouse cells at the 1st, 8th, and 17th passages. n = 5 for 1st, 8th, 17th passage immortalized cells, respectively. (f) FACS analysis of tubule segment markers in cells at the 4th and 20th passages. Immortalized cells at the 4th and 20th passages were stained with anti-AQP1, PNA, nephrin, or AQP2 (open histograms) or isotype control mAb (grey histograms). (g) GGT activity of mouse immortalized primary cells compared to a mouse tubular cell line (TCMK-1). n = 6 for TCMK-1 and mouse renal primary cells, respectively. (h) Dextran uptake by mouse immortalized primary cells at the 8th passage after 48 h of incubation with Alexa Fluor 488-conjugated dextran. (i) Representative images of immunostaining for E-cadherin and Zo-1 in CTL and AQP1-, AQP2-, podocin-, or THP-depleted cells. Cells were at the 5–7th passages and the depleted population was obtained from negative fractions via magnetic activated cell sorting. (j,k) Western blotting (j) and quantitative RT-PCR (k) analyses for epithelial-mesenchymal transition of cells of the CTL and AQP1-, AQP2-, podocin-, or THP-depleted population. The grouping of gels/blots cropped from different parts of the same gel. (l,m) The amounts of BMP7 (l) and TGFb1 (m) secreted by cells of the CTL and AQP1-, AQP2-, podocin-, or THP-depleted population. n = 4 for CTL and AQP1-, AQP2-, podocin-, or THP-depleted cells, respectively. All data are shown as the means ± s.e.m. *p < 0.05 compared with primary cells, TCMK-1 or CTL by unpaired Student’s t-test. Scale bar, 20 μm.

