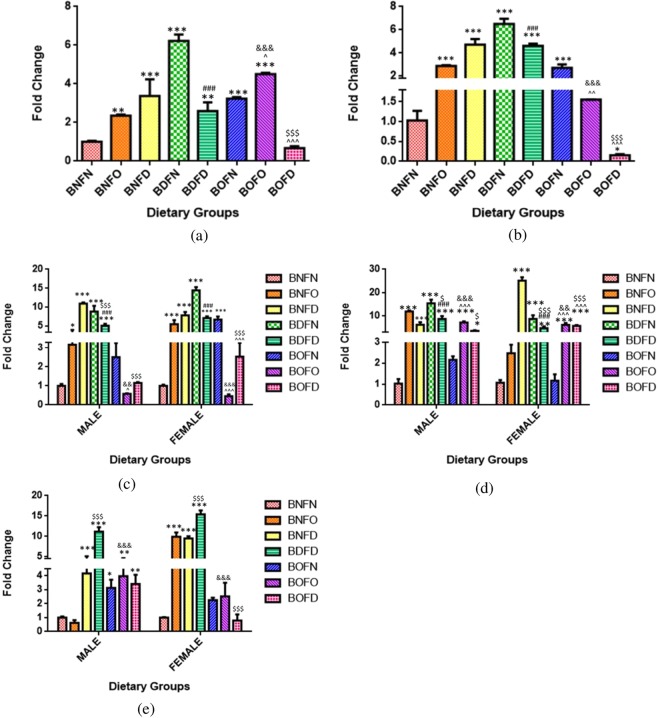
Figure 6.
Quantification of miRNA-483 in maternal tissues. (a) Brain (F = 74.31, df = 7). (b) Placenta (F = 178.3, df = 7), fetal tissues. (c) Liver (Male) (F = 94.7, df = 7) (Female) (F = 106.3, df = 7). (d) Brain (Male) (F = 95.9, df = 7) (Female) (F = 243.9, df = 7). (e) Kidney (Male) (F = 80.1, df = 6) (Female) (F = 215.0, df = 6). *p < 0.05, **p < 0.01, ***p < 0.001 vs BNFN, #p < 0.05, ##p < 0.01, ###p < 0.001 vs BDFN, ^p < 0.05, ^^p < 0.01, ^^^p < 0.001 vs BOFN, $p < 0.05, $$p < 0.01, $$$p < 0.001 vs BNFD and &p < 0.05, &&p < 0.01, &&&p < 0.001 vs BNFO. The data is presented as mean ± SD. (N = 3). B12 normal folate normal (BNFN), B12 normal folate over-supplemented (BNFO), B12 normal folate deficient (BNFD), B12 deficient folate normal (BDFN), B12 deficient folate over-supplemented (BDFO), B12 deficient folate deficient (BDFD), B12 over-supplemented folate normal (BOFN), B12 over-supplemented folate over-supplemented (BOFO), B12 over-supplemented folate deficient (BOFD).

