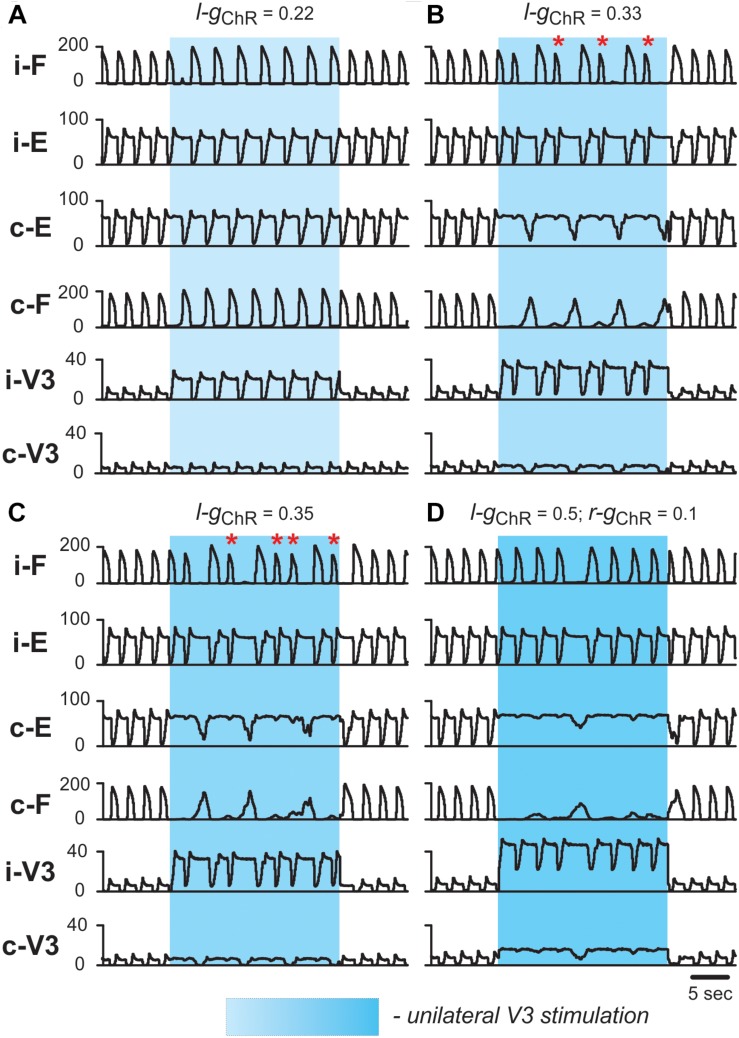
FIGURE 10.
Effect of unilateral stimulation of V3 commissural interneurons during fictive locomotion in the model. Fictive locomotion was evoked at α = 0.065. All panels show integrated population activities of the flexor (F) and extensor (E) rhythm generator centers and the V3 populations ipsi- and contralateral to the stimulation. Shaded blue areas show the interval when V3-stimulation was applied. Four different stimulation intensities are shown: (A) gChR = 0.22; (B) gChR = 0.33; (C) gChR = 0.35; (D) gChR = 0.5 in ipsilateral and gChR = 0.1 in contralateral V3 population. Red asterisks mark additional flexor bursts on ipsilateral side. i-: ipsilateral; c-: contralateral.

