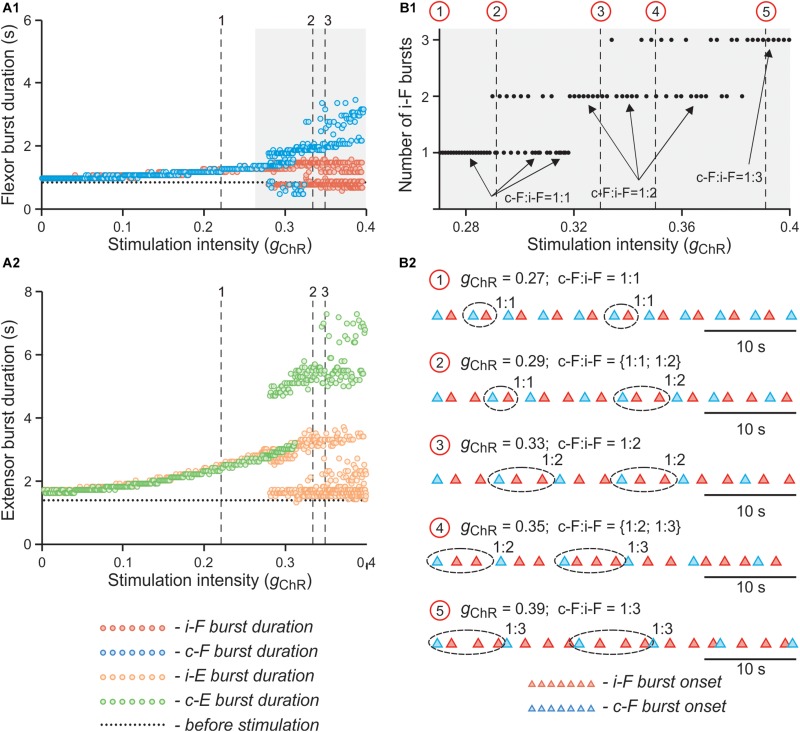
FIGURE 11.
Effect of unilateral stimulation intensity of V3 interneurons on flexor and extensor burst durations and oscillation period in the model. (A1,A2) Dependence of flexor (A1) and extensor (A2) burst durations on intensity of stimulation (gChR) when stimulation was applied to the left V3 population. Intensity of stimulation was gradually changed from 0 to 0.4. The vertical lines (1, 2 and 3) correspond to simulations shown in Figures 10A–C, respectively. (B1,B2) Dependence of number of additional ipsilateral flexor bursts during single contralateral period on parameter gChR at higher values of stimulation intensity In (B1), gChR was gradually changed from 0.27 to 0.4. Arrows indicate 1:1, 1:2, and 1:3 ratios between the number of ipsi- and contralateral flexor bursts. Red circles and vertical lines indicate selected values of gChR for which additional simulations were run when gChR was fixed. In (B2), the timing of flexor burst onsets for these simulations are shown. The corresponding values of gChR for each simulation are indicated above each trace. Traces are shown for 40 s of simulated time. i-: ipsilateral; c-: contralateral; F - flexor rhythm generator center.

