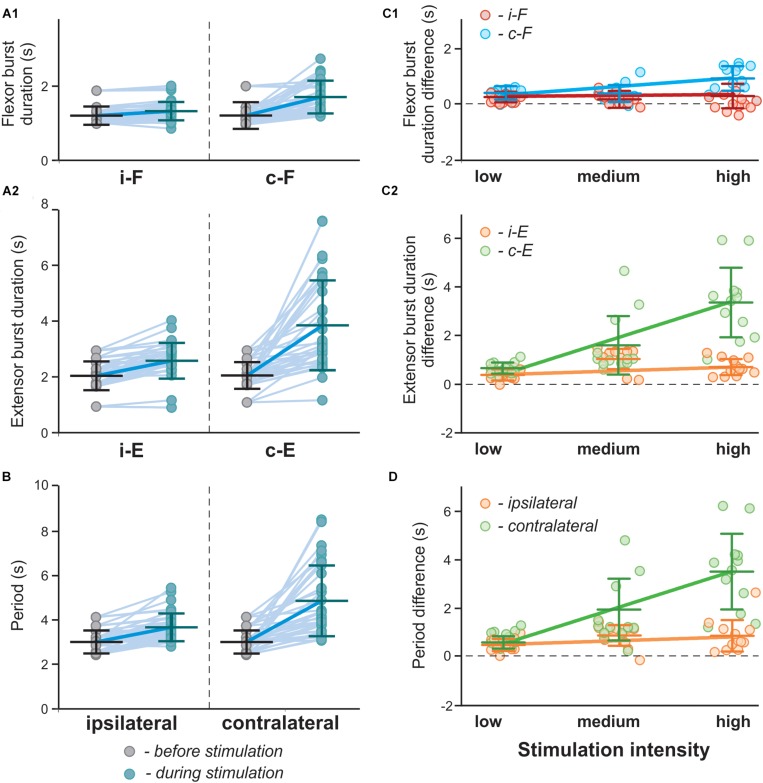
FIGURE 12.
Effect of unilateral stimulation of V3 interneurons on flexor and extensor burst durations and oscillation period in the model. (A1,A2,B) Flexor (A1) and extensor (A2) burst duration and period of oscillations (B) in a series of model experiments with randomly chosen parameters α and gChR before (gray circles) and during (blue circles) stimulation of the left V3 populations. Each circle represents the average value of estimated parameter for one simulation. Light blue lines connecting two circles represent parameter change in one simulation Thick, dark blue line represent the average of change. (C1,C2,D) Differences in flexor (C1) and extensor (C2) burst duration and period of oscillations (D) for the above modeling experiments estimated according to stimulation intensity. Low stimulation intensity corresponds to gChR ∈ [0.18,0.25], medium, gChR ∈ [0.26,0.33], in stimulations with high intensity gChR ∈ [0.33,0.4]. Linear regression slopes are orange for ipsilateral and green for contralateral extensor centers and red for ipsilateral and blue for contralateral flexor extensor centers. i-: ipsilateral; c-: contralateral.

