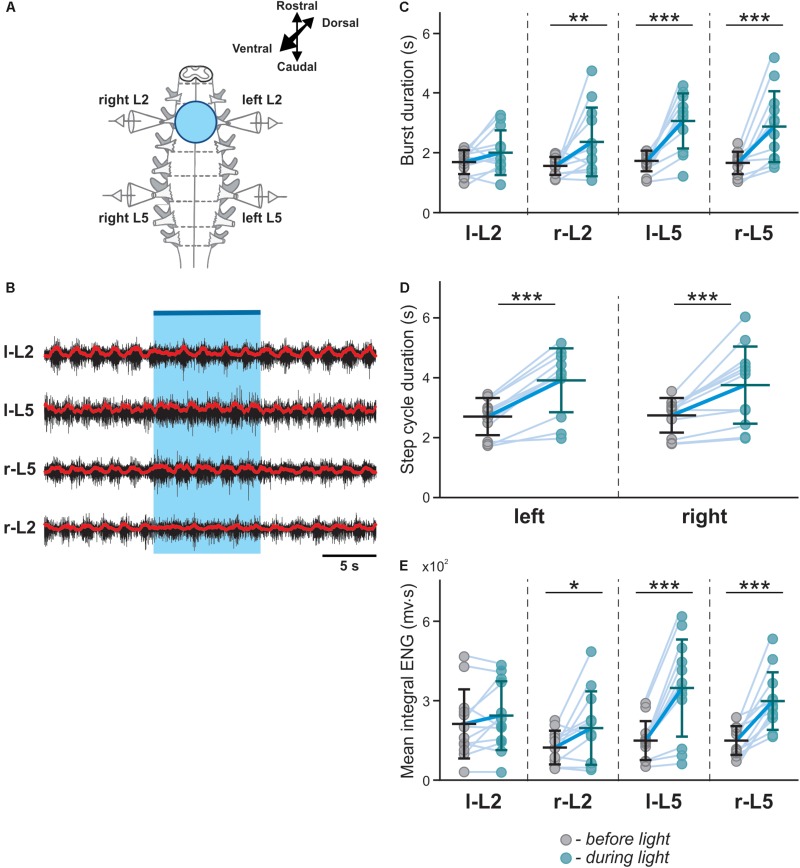
FIGURE 2.
Symmetric optical activation of both sides of V3 interneurons in L2 ventral region during drug-evoked fictive locomotion and changes in ENG characteristics. (A) Experimental setup. (B) Optical activation of lumbar V3 interneurons increases the intensity of extensor motor output and slows oscillation frequency of drug-evoked fictive locomotion. Fictive locomotion was induced by drug cocktail (5-HT 8 μM, NMDA 8 μM) in Sim1cre-Ai32 cord. The blue bar on the top and shaded blue area represent the optical stimulation period. Red lines are rectified and smoothed traces of the original ENG recordings (black). (C–E) Burst duration, step cycle duration, and mean integral ENG during drug-induced locomotor-like activity (n = 12) before (gray circles) and during (blue circles) optical activation. Each circle represents the average value of estimated parameter for one trace. Light blue lines connecting two circles represent parameter increase in one cord. Thick, dark blue line represent the average of increase. ∗ indicates P < 0.05, ∗∗ indicates 0.01 < P < 0.05, ∗∗∗ indicates 0.0001 < P < 0.001.

