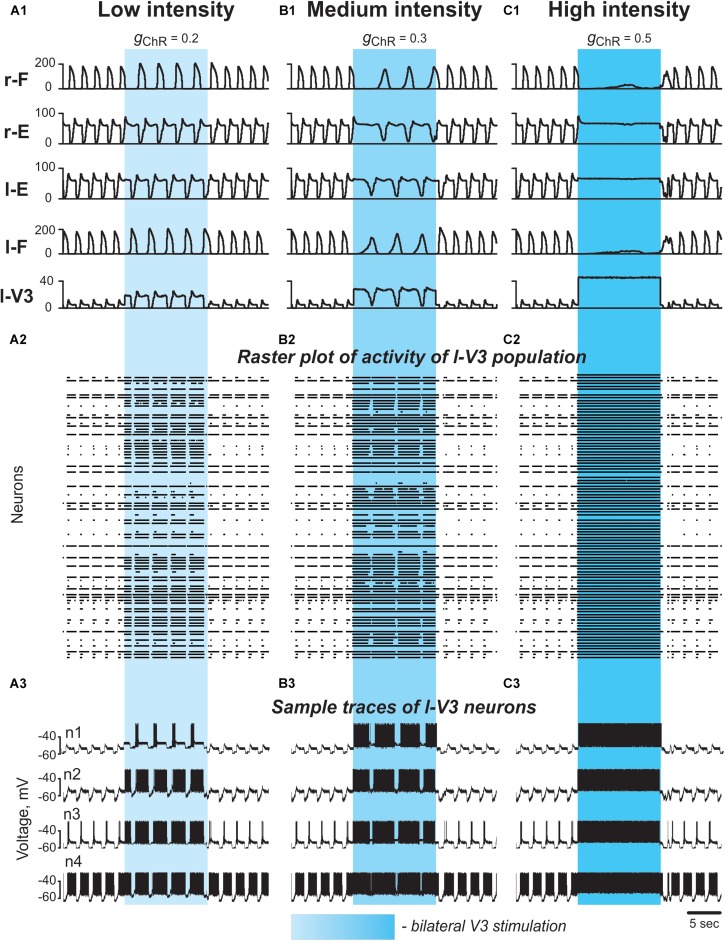
FIGURE 8.
Effect of bilateral stimulation of V3 commissural interneurons during fictive locomotion in the model. (A1–A3) Low V3-stimulation intensity (gChR = 0.2). (B1–B3) Medium V3-stimulation intensity (gChR = 0.3). (C1–C3) High V3-stimulation intensity (gChR = 0.5). Stimulation was applied to all V3 neurons (on both sides of the cord). For all stimulations fictive locomotion was evoked at α = 0.06. (A1,B1,C1) Integrated population activities of the flexor and extensor rhythm generator centers and the left V3 population. (A2,B2,C2) Raster plots of spikes elicited by neurons in the left V3 population. (A3,B3,C3) Traces of the membrane potential of sample neurons in the left V3 population with different excitability. Shaded blue areas show the interval when V3 stimulation was applied. r-: right; l-: left.

