Fig. 7.
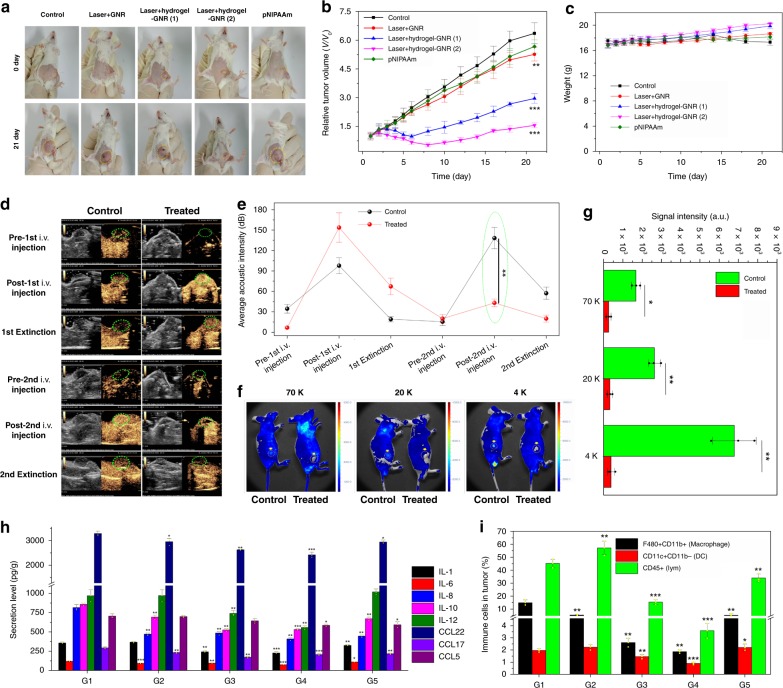
In vivo starvation therapy against 4T1 breast tumors subcutaneously implanted on BALB/c mice. a–c Digital photos of 4T1 xenografted breast tumors subcutaneously implanted on immune-competent BALB/c mice experiencing different treatments at 0 day and 28 day, i.e., control, Laser+GNR, Laser+hydrogel–GNR (1), Laser+hydrogel–GNR (2) and pNIPAAm, and yellow dotted ellipse indicates the tumor. b, c Time-dependent tumor volume (b) and weight (c) variation profiles of 4T1 xenografted breast tumors implanted on BALB/c mice after experiencing aforementioned different treatments. Error bars are based on SD (n = 6); **P < 0.01 and ***P < 0.001, which were calculated via unpaired Student’s t test in comparison to the control group. d, e Time-dependent ultrasonic images (d) and acoustic intensities (e) of 4T1 tumor before and after corresponding treatments in control (i.e., Laser+GNR) and treated (i.e., Laser+hydrogel–GNR (2)) groups, wherein SonovueTM microbubbles that can illuminate tumor were used to evaluate the intratumoral occlusion, and green dotted ellipse indicates the tumor, and data are expressed as mean ± SD (n = 3), f, g In vivo animal fluorescence images (f) and signal intensities (g) of 4T1 tumor after corresponding treatments in control (i.e., Laser+GNR) and treated (i.e., Laser+hydrogel–GNR (2)) groups and subsequent injection of different FITC-labeled dextrans with varied sizes (i.e., 70, 20, and 4 K), wherein yellow arrows and dotted circles indicate the tumor, and data are expressed as mean ± SD (n = 3). *P < 0.05 and **P < 0.01, which were obtained using student's t test. h Secretion levels of different inflammationatory cytokines obtained by ELISA analysis in 4T1 tumors after aforementioned different treatments (G1–G5) at day 10, and data are expressed as mean ± SD (n = 3). i Quantitative variations of tumor infiltrating including macrophages (CD11b+F480+), dendritic cells (Cd11b-CD11c+) and leukocytes cells (CD45+) in 4T1 tumors after aforementioned different treatments (G1–G5) at day 10, and data are expressed as mean ± SD (n = 3). *P < 0.05, **P < 0.01 and ***P < 0.001, which were obtained using student's t test in comparison to G1. Note: G1–G5 represent control, Lase+GNR, Laser+hydrogel–GNR (1), Laser+hydrogel-GNR (2) and pNIPAAm, respectively.

