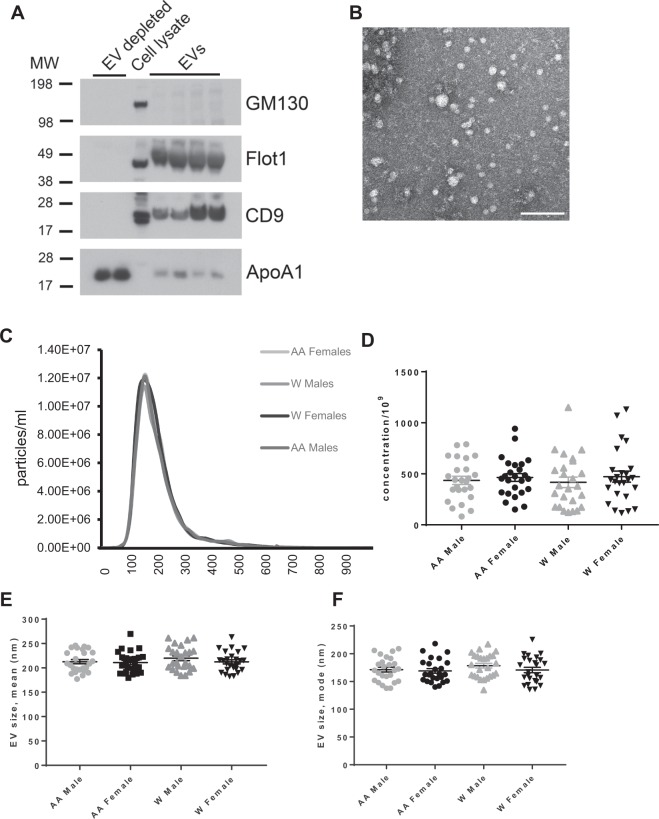
Figure 1.
EV characteristics across different demographics. (A) Two EV-depleted samples as negative controls, cell lysate, and plasma EV samples were lysed with MPER, analyzed by SDS-PAGE and probed for the known EV markers CD9 and Flotillin1 (Flot1) and the purity markers GM130 and Apolipoprotein A1 (ApoA1). Full immunoblots are in Supp. Fig. 2. (B) Electron microscopy images of plasma EVs scale bar = 200 nm. (C) EV size distribution, (D) concentration, (E) size mean, and (F) size mode were analyzed across each demographic using Nanoparticle Tracking Analysis (NTA). Two-way ANOVAs tested the association of sex and race with EV size mean, size mode or concentration. Lines indicate the mean and bars indicate the standard error of the mean. AA, African American; W, white.

