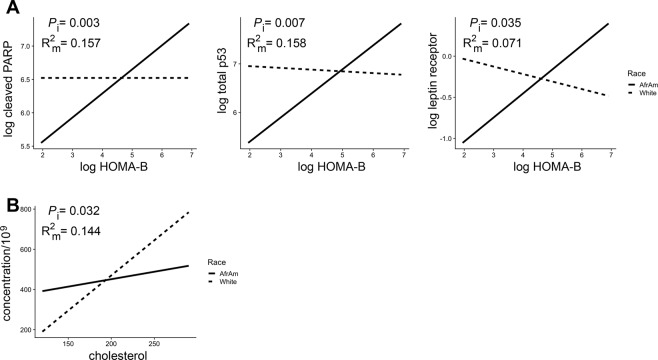
Figure 5.
Significant interactions of EV proteins and concentration and HOMA-B, cholesterol and race. Linear regression was used to analyze each EV protein or EV concentration on the interaction of (A) HOMA-B and (B) cholesterol, and race. P values for the interactions (Pi) and the R2 for the model (R2m) are indicated. Solid lines = African Americans (AfrAm) and dashed lines = whites. HOMA-B, homeostatic model assessment of β-cell function.

