
Figure 2.
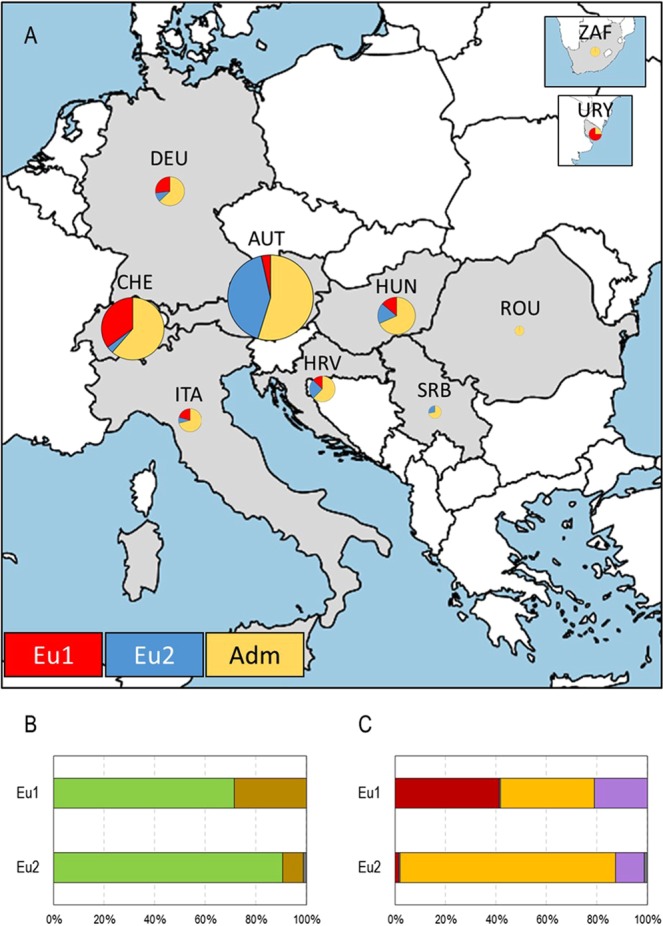
Analysis of the effect of sampling site (A), feeding form (B) and host plant (C) on grape phylloxera structure in Europe. In A, the geographic distribution of the two genetic groups obtained by STRUCTURE (Eu1 and Eu2) in the geographic range analysed is shown (AUT: Austria; CHE: Switzerland; DEU: Germany; HRV: Croatia; HUN: Hungary; ITA: Italy; ROU: Romania; SRB: Serbia; URY: Uruguay; ZAF: South Africa). Every country is represented as a circle, which size is proportional to the number of individuals sampled, and its colour represent the number of MLGs assigned to Eu1 (red), Eu2 (blue) or unassigned (admixed, yellow). In B, the percentage of grape phylloxera samples collected from leaves (green) and roots (brown) are shown for each genetic group (Eu1, Eu2). Samples from unknown origin are shown in grey. In C, the percentage of grape phylloxera samples collected from Vitis spp. interspecific hybrid direct-producers (dark red), Vitis spp. interspecific resistant grape varieties (light green), Vitis spp. interspecific rootstocks (yellow) and Vitis vinifera L. cultivars (violet) are shown for each genetic group (Eu1, Eu2). Samples collected of plants whose identity could not be confirmed are shown in grey. Map shown in A was created by using MapChart (https://mapchart.net).