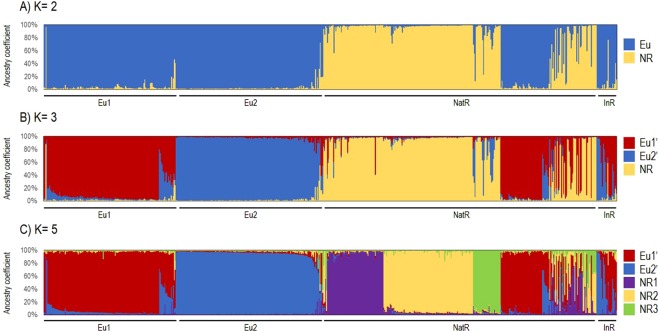
Figure 3.
STRUCTURE analysis to elucidate the origin of grape phylloxera in Europe. The population structure of 302 grape phylloxera MLGs from Europe (143 of Eu1 and 159 of Eu2) and 319 MLGs from the native range (NatR) and diverse introduced regions (InR, data from Lund et al.3) was analysed considered 4 SSR loci. In each plot, every MLG is shown as a vertical line, whose colour(s) indicate ancestry proportions. The three levels of genetic stratification shown at K = 2 (A), K = 3 (B) and K = 5 (C) were determined according to the ΔK criteria proposed by Evanno et al.46. Considering a critical ancestry coefficient of Q ≥ 0.80, two genetic groups (Eu and NR, with 376 and 212 MLGs respectively) were obtained at K = 2. At K = 3, three genetic groups (Eu1’, Eu2’ and NR, with 188, 160 and 195 MLGs, respectively) were observed. At K = 5, five genetic groups (Eu1’, Eu2’, NR1, NR2 and NR3, Eu1’ and Eu2’, with 172, 157, 62, 97 and 30MLGs, respectively) were obtained.

