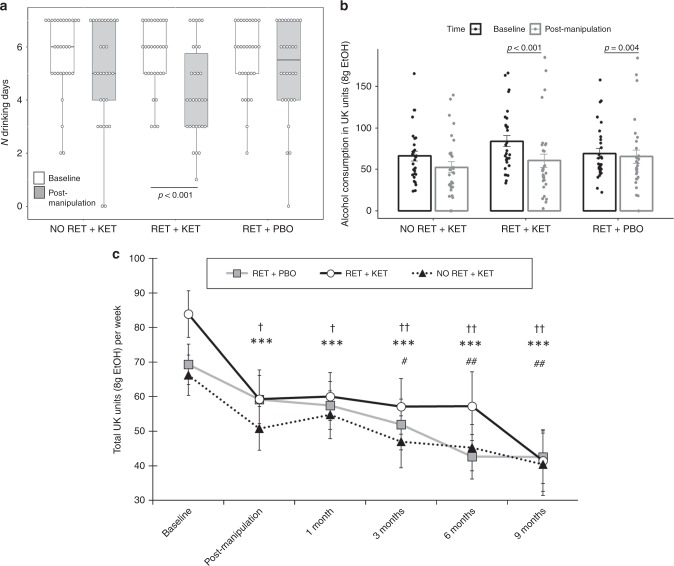
Fig. 2.
Changes in drinking outcomes. a Reduction in number of drinking days from Day 1 (baseline) to Day 10 (post manipulation) in RET + KET only. Dots are individual data points, boxes and lines represent mean ± IQR, whiskers represent range. b Reductions in total alcohol consumption per week (UK units) across the same period bars are mean ± SEM and dots individual data. c Changes in alcohol consumption across all measured time points. Data points and bars represent mean/SD using all participant data available at each time point. Significant reductions from baseline are denoted by † for No RET + KET, * for RET + KET and # for RET + PBO. One symbol = p < .05, two symbols = p < .01, three symbols = p < .001. In all panels, p-values are from F tests of simple contrasts against baseline within-group. Individual data points for b, c are given by group in Fig. 3. Source data are provided as a Source Data file

