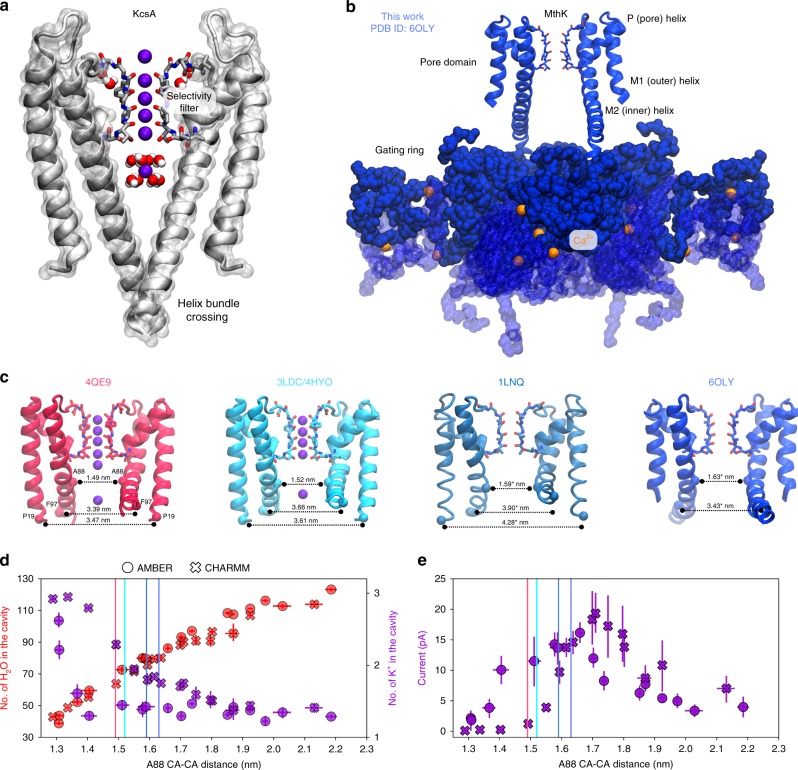
Fig. 1.
An overview of potassium channel gating. a Crystal structure of KcsA in a closed state (PDB ID: 1K4C), showing the helix bundle crossing of the AG and the SF in the conductive state (two diagonally opposite monomers are shown for clarity). b Crystal structure of a full-length MthK channel in an open conformation. The pore (transmembrane (TM)) domain is linked to the cytoplasmic domains termed gating ring (shown in blue surface), which bind Ca2+ ions (orange spheres). The conformational changes of the gating ring pull M2 helices from the pore domain, which underlies gating transitions. c Crystal structures of MthK showing different levels of TM helices opening. The cross distances between CA atoms of residues P19, F97, and A88 between diagonally opposite monomers of a channel tetramer are shown (* indicates that the monomers are placed asymmetrically in the crystal structure; in this case, the average distance is shown). In all structures, the SF is modeled in the conductive state. d Number of water molecules and potassium ions in the cavity observed in MD simulations of MthK, as a function of channel opening (A88 CA–CA distance, see c). Opening levels observed in crystal structures are shown as vertical lines. e Outward K+ current through MthK at 300 mV as a function of AG opening. Error bars represent 95% confidence intervals. Source data are available as a Source Data file.

