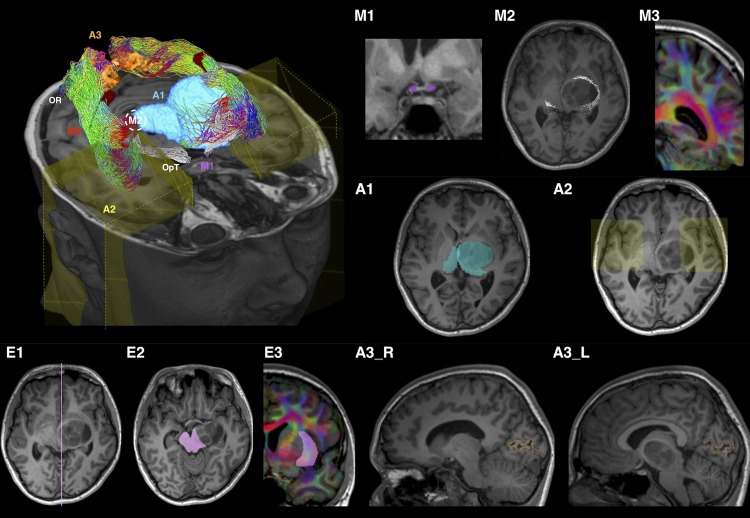
FIGURE 2.
Optic radiation (OR) tractography regions-of-interest (ROI) summary, illustrated using patient ID01 MRI data (with a left thalamic tumor). The 3D volume rendered image is oriented by anatomic convention. The MRI images are oriented by radiology convention. The tractography method involves applying one manually defined seed ROI (M2), two manually drawn inclusion ROIs (M1 and M3), three automated inclusion ROIs (A1–A3), and three manually drawn exclusion ROIs (E1–E3). M1, optic tract (OpT); M2, lateral geniculate body (LBG); M3, internal and intermediate sagittal stratum; A1, right thalamus and left combined thalamus and tumor mask; A2, anterior temporal regions; A3_R/L, right/left peri-calcarine cortex; E1, sagittal midline; E2, midbrain at the level of inferior colliculi; E3, external and extreme capsules. The LGBs are marked by white dash circles in both the volume rendered and MR (M2) images. ROI M3 and E3 are delineated using the diffusion directionally-encoded color (DEC) images displayed in T1 resolution. In the volume rendered image, the OR tractography is color-coded by tract directions, same as the DEC images: left-right (red), superior-inferior (blue), and anterior-posterior (green). The OpT tractography is shown in white color.

