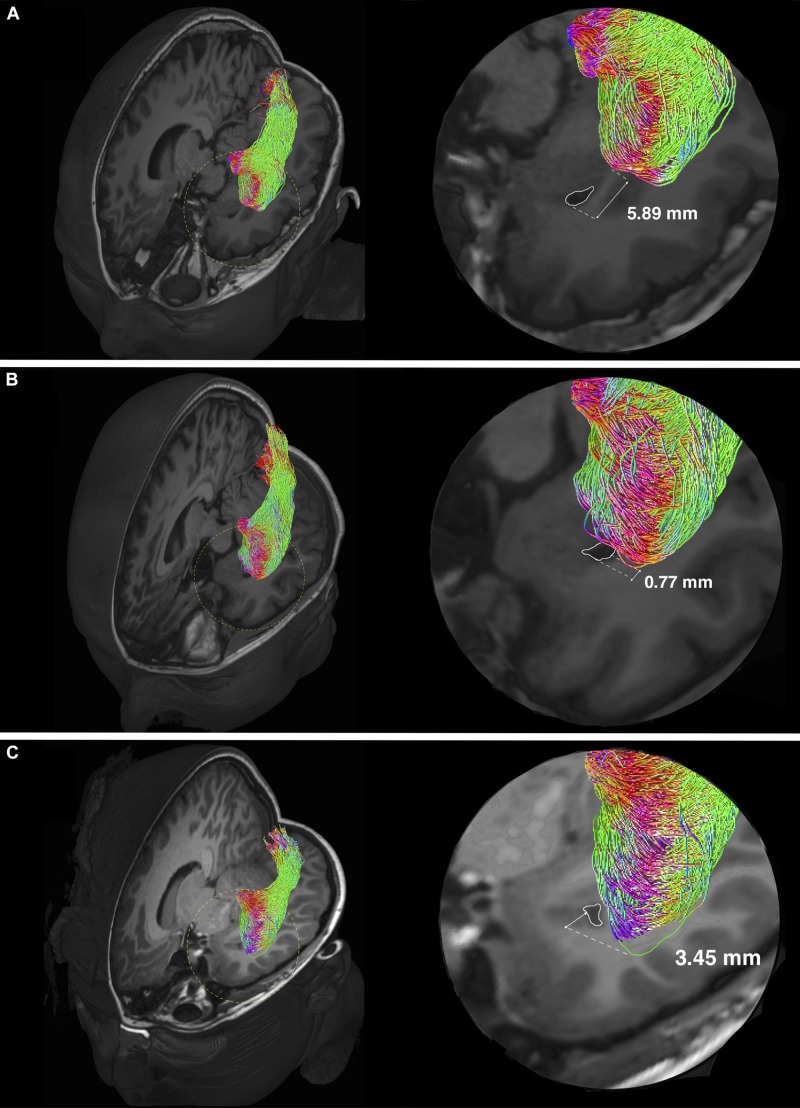
FIGURE 5.
Individual variability of the Meyer’s loop position in temporal lobe. Optic radiation tractography examples showing variations of the anterior bundle/Meyer’s loop (ML) position, relating to the temporal ventricular horn (TH) (delineated by white colored lines). Magnified views (delineated by yellow colored dashed circles) are shown on the left. The anterior edge of AB/ML can be behind (A), approximately at the level (B) and in front (C) of the TH. The TH-ML distance is expressed in millimeters. In panel (C), the green colored line delineates the anterior edge of AB/ML, which is slightly out-of-plane.

