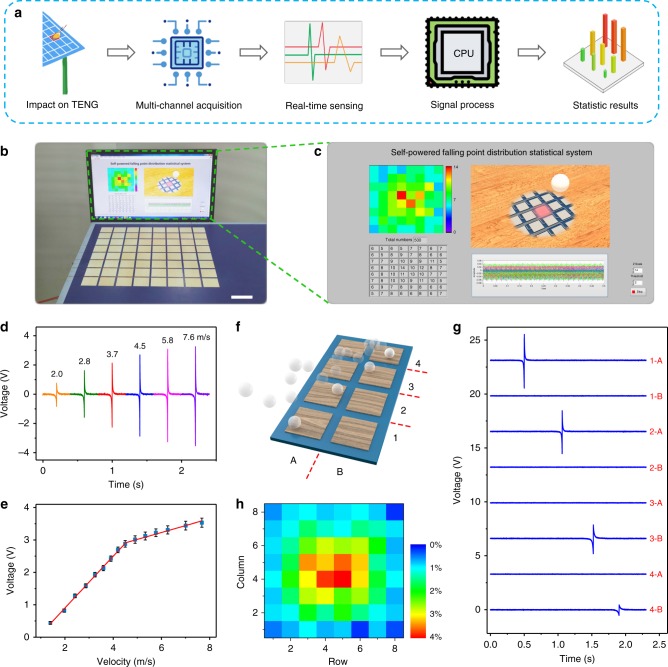
Fig. 4.
Application of the W-TENG in a self-powered falling point distribution statistical system. a Scheme diagram of the W-TENG based self-powered falling point distribution statistical system. b Demonstration of the self-powered falling point distribution statistical system. Scale bar, 6 cm. c Screenshot showing the real-time statistical result of the self-powered system. d The measured output voltage of the TENG under the impact of ping-pong balls with variable velocities. e The summarized relationship and linear fitting between output voltages and velocities. Error bars indicate standard deviations for five sets of data points. f Graphical illustration showing the moving path of the ping-pong ball above a 4 × 2 W-TES array. g Real-time output voltage signals when a ping-pong ball impacted the surface of a 4 × 2 W-TES array along a path: 1-A → 2-A → 3-B → 4-B. h 2D mapping figure showing the distribution of statistical percentage of the falling points

