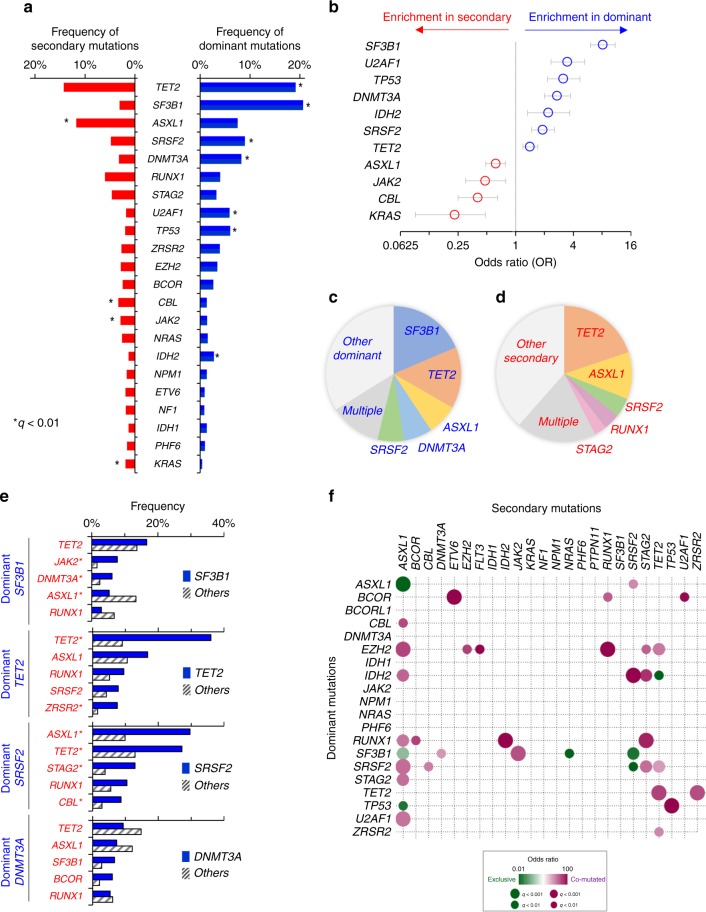
Fig. 2.
Comparison of dominant- and secondary mutations, and their combinations. a Comparison of frequencies of dominant vs. secondary recurrent somatic mutations (recurrent is defined here as >2%, n = 22); * indicate q < 0.01, where q is the Benjamini–Hochberg corrected Fisher’s exact test P-value. b Odds ratios and 95% confidential intervals of genes more likely to have dominant (blue) or secondary (red) mutations. c, d Proportion of top five frequent genes for (c) patients with dominant mutations, and (d) those with secondary mutations. Patients with multiple dominant or secondary mutations in the top five genes belong to the group called Multiple. e Nonrandom associations between dominant and secondary mutations. Shown are secondary mutations in each of top four dominant mutational groups. Bars indicate frequencies of secondary mutations in patients with (blue) vs. without (striped) dominant mutation. *q < 0.01, Fisher’s exact test P-values with Benjamini–Hochberg correction. f Correlation of dominant and secondary mutations. Recurrent dominant (>1%, n = 16) and secondary mutations (>1%, n = 22) are given in the y- and x-axes, respectively. Co-occurrence and mutually exclusivity are encoded in purple and green color gradients, respectively. Circle sizes encode q-values (Fisher’s exact test P-values with Benjamini–Hochberg corrections).

