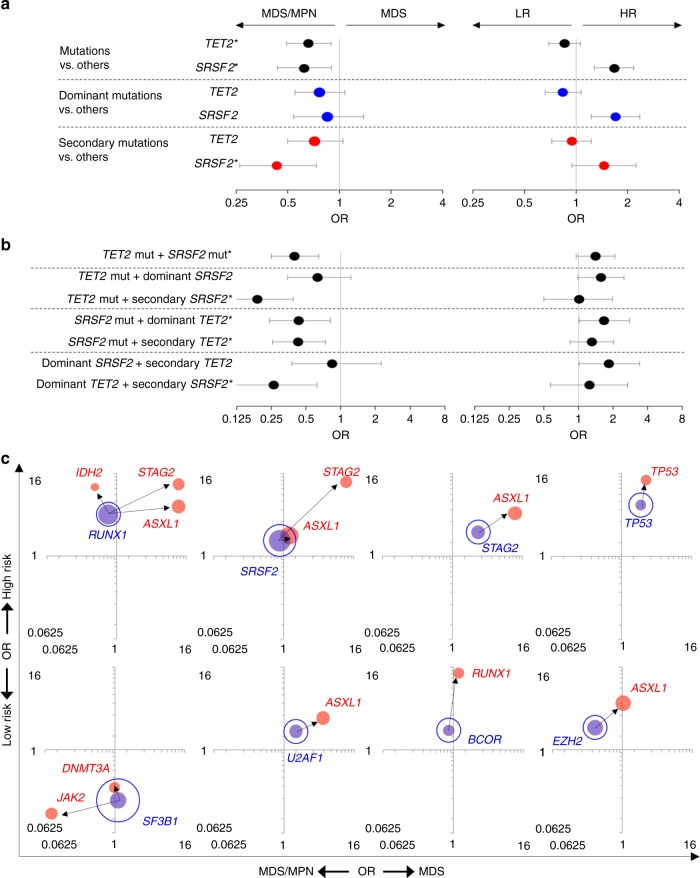
Fig. 3.
Clinical effects for frequent pairs of dominant and secondary mutations. a, b Clinical features for patients with TET2 and/or SRSF2 mutations. Forest plot shows the odds ratios (OR) of MDS vs. MDS/MPN (left side) and high (HR) vs. low-risk (LR) subtypes (right side) for genetic events of (a) single mutation and (b) pairs of mutations, respectively. The significance was determined by Fisher’s exact test; *P < 0.05 (MDS vs. MDS/MPN). Circle and error bars indicate OR and 95% confidence interval. Blue and red dots depict dominant and secondary mutations. c Clinical feature dependence on mutation combinations. Phenotypic features compared are MDS (n = 1583) vs. MDS/MPN (n = 226) on the x-axis, and low- (n = 1043) vs. high-risk (n = 766) groups on the y-axis. The area of each bubble indicates the frequency of mutations identified in 1809 MDS patients. Bubbles colored blue and red showed dominant and secondary mutations, respectively. Arrows indicate mutation sequence/ordering. All pairs of dominant and secondary mutations with significant phenotypic effects are highlighted by filled bubbles connected by arrows.

