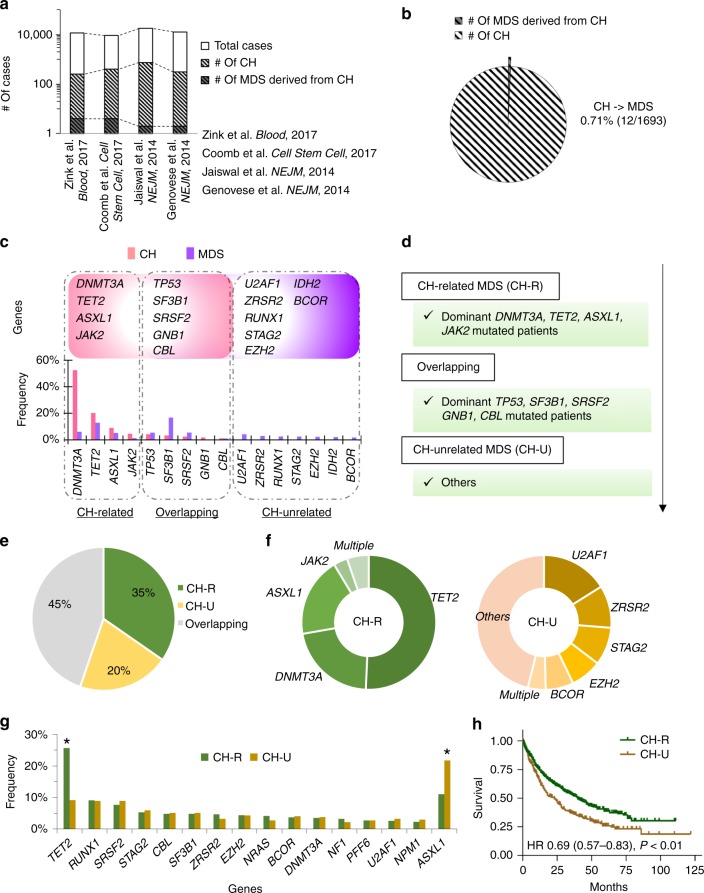
Fig. 5.
Characteristics of clonal hematopoiesis (CH)-related MDS. a The number of cases with sequenced, CH and MDS derived from CH in different four cohorts. Four papers are also shown. b Penetrance from CH to CH-derived MDS. Pie chart shows the number of cases with CH and CH-derived MDS in merged four cohorts. c Genes and frequencies of mutations in CH and MDS cohorts. Frequencies of mutation in the CH cohort and of dominant mutations in the MDS cohort are shown light pink and purple bar graphs, respectively; four genes (DNMT3A, TET2, ASXL1, and JAK2) which were mutated in MDS and frequently in CH are shown on the left. Five genes (TP53, SF3B1, SRSF2, GNB1, and CBL) which were mutated with similar frequency in both cohorts are shown in the middle. Seven genes that are frequently dominant mutants in MDS and uncommon in CH are shown on the right. These distinct groups are marked CH-related (CH-R), overlapping, and CH-unrelated (CH-U). d Estimating CH-related MDS. MDS patients with dominant mutations of DNMT3A, TET2, ASXL1, and JAK2 were defined as CH-related. Those with TP53, SF3B1, SRSF2, GNB1, and CBL were defined overlapping. Finally, those with dominant mutations were defined as CH-unrelated. e Proportion of CH-R, CH-U and Overlapping MDSs. Pie chart shows MDS patients (n = 1809) divided into CH-R (n = 627), CH-U (n = 373), and overlapping MDS (n = 809). f Fractions of genetic mutations in CH-R and CH-U MDSs. Pie charts show fractions of genes with dominant mutations in CH-R (n = 627) and CH-U MDSs (n = 373). g Frequency of secondary mutations in CH-R (green) and CH-U MDS (yellow). *q < 0.01 (Fisher’s exact test P-values with Benjamini–Hochberg correction). h CH-R MDS cases have a better prognosis. Kaplan–Meier curves for overall survival among patients with CH-R MDS (green) and with CH-U MDS (yellow) are depicted. Tick marks indicate censored data.

