Figure 1.
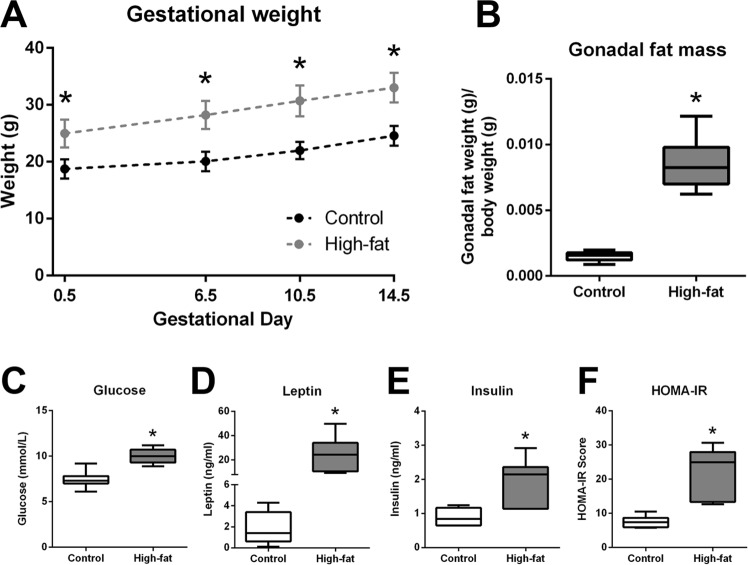
High-fat fed dams were heavier than controls at conception and throughout gestation and displayed increased adiposity, hyperglycemia, hyperleptinemia, hyperinsulinemia, and insulin resistance at E14.5. (A) Maternal body mass (g) during pregnancy in control (dark grey symbols, n = 7) and high-fat (light grey symbols, n = 9) fed dams. (B) Gonadal fat mass in control and high-fat fed dams. (C) Whole blood glucose in control and high-fat fed dams. (D) Serum leptin in control and high-fat fed dams. (E) Serum insulin in control and high-fat fed dams. (F) Homeostatic model assessment of insulin resistance (HOMA-IR) in control and high-fat fed dams. Data are presented as mean ± SEM (A) or box and whisker plots (B–F), min to max, where the centre line represents the median. Data were analyzed using a 2-way repeated measures ANOVA with Bonferroni’s post-hoc multiple comparisons and Student’s t-test where appropriate. *p < 0.05. Control: open boxes, (n = 7) and high-fat: grey boxes, (n = 9).

