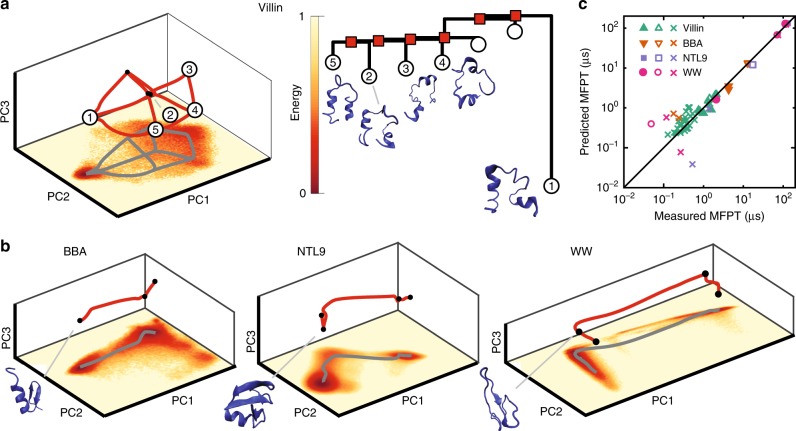
Fig. 2.
Reconstructed MEP networks for protein-folding transitions. We compare predicted MFPTs with direct estimates from molecular dynamics (MD) simulations (Supplementary Methods). a Left: low-energy states and transition network in the first three principal components (PCs) for Villin including predicted transition paths between states (red lines); bottom coloring shows two-dimensional projection of the empirical energy landscape onto the first two PCs. Right: associated disconnectivity graph and illustrations of the five lowest energy states, with state 1 corresponding to the folded state. b Low-energy states, transition paths, and empirical energy landscape for BBA, WW, and NTL9 proteins, and sketches of their folded states. c Predicted MFPTs agree well with estimates from MD simulations when energy minima are well separated and become less accurate for fast transitions with small MFPTs. Filled shapes correspond to transitions ending in the unfolded state and unfilled shapes correspond to transitions ending in the folded state (Supplementary Methods), for Villin, BBA, NTL9, and WW. Crosses correspond to transitions between intermediate states.

