Fig. 4.
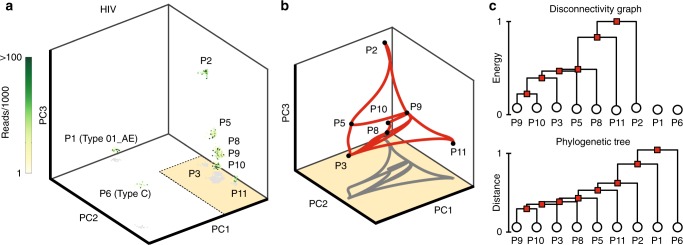
MEPs on viral fitness landscapes reconstructed from publicly available HIV sequencing data50. a Longitudinal samples of the HIV virus are binarized after multiple sequence alignment (Supplementary Methods) and plotted in the first three PCs. Samples of the same HIV subtype are closer in PC-space. Patient labels correspond to those used in ref. 50. b MEPs between minima corresponding to patients infected with Type B HIV, plotted in the first three PCs. Paths between minima indicate likely evolutionary pathways. Minima corresponding to patients with Type 01_AE and Type C HIV were unconnected to the other minima. c Disconnectivity graph for connected minima, where vertical evolution frequency is assumed to be proportional to the normalized energy barriers (top). The disconnectivity graph reproduces the majority of the structure of a distance-based phylogenetic tree (bottom), where the lengths of vertical lines are proportional to the Jukes-Cantor sequence distance (scaled to ).

