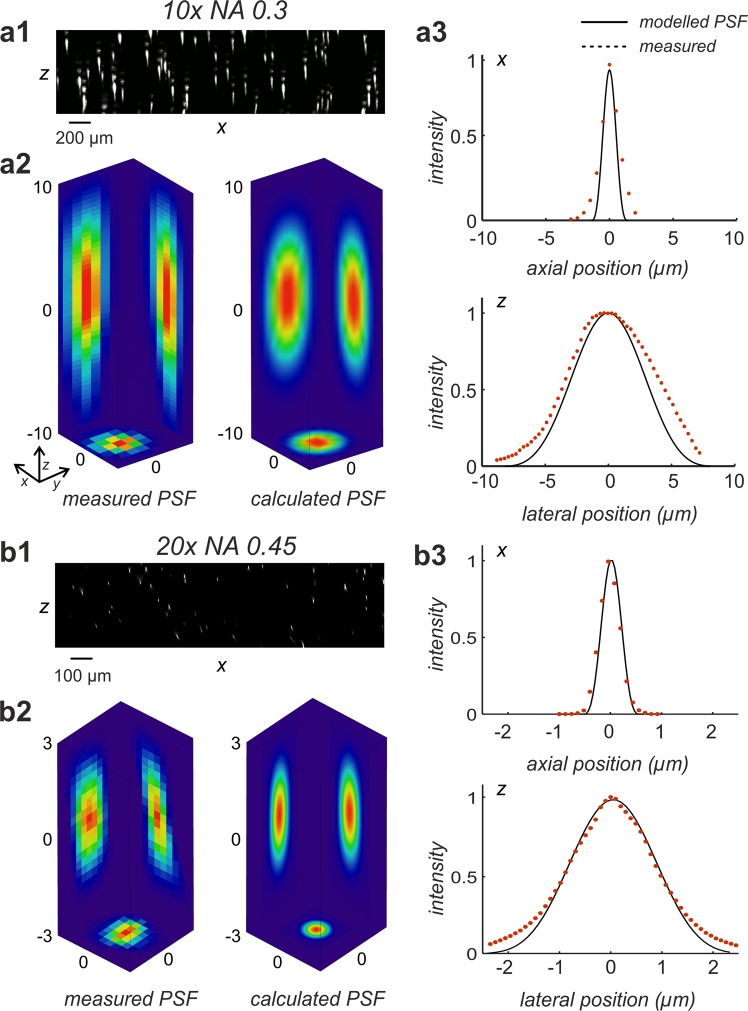
Figure 2.
Comparison between measured and modelled PSFs of a light sheet microscope. (a1) 200 nm sized fluorescent beads were recorded using a 10x objective with NA = 0.3 (UPLFLN 10x, Olympus, Germany). The figure shows a maximum intensity (MIP) projection (xz-direction) obtained from 402 slices. (a2) PSF extracted by registration and averaging of 10 manually selected beads from (a1) (left), compared to a calculated PSF according to Eq. (15) (Model parameters: NA = 0.3, λex = 488 nm, λem = 520 nm, n = 1.561, f = 80 mm, d = 8 mm, no damping). (a3) comparison of lateral (x, y = 0, z = 0) and axial (x = 0, y = 0, z) intensity profiles of the measured and the modelled PSFs depicted in (a2). (b1) 200 nm fluorescent beads were recorded using a 20x objective with NA = 0.45 (LUCPLFLN, Olympus, Germany). The panel shows a maximum intensity projection (MIP, xz-direction) of the 3D reconstructed fluorescent beads obtained from 500 slices. (b2) PSF obtained after registration and averaging of 10 manually selected beads from b1 (left) versus a calculated PSF according to Eq. (15). (Model parameters: NA = 0.6, λex = 488 nm, λem = 520 nm, n = 1.561, f = 80 mm, d = 8 mm, no damping). (b3) comparison of lateral (x, y = 0, z = 0) and axial (x = 0, y = 0, z) intensity profiles of the measured and of the modelled PSFs depicted in (b2). As for the 10x objective visual comparison confirms a good agreement between measurements and theory.

