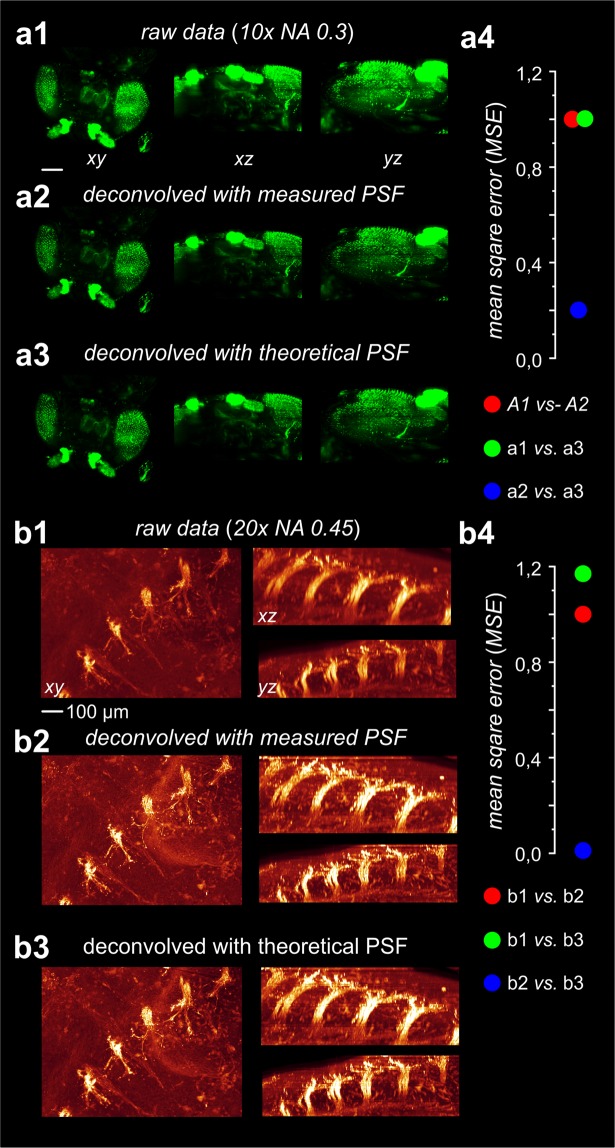
Figure 3.
Comparison of deconvolution results either obtained using a measured PSF or a modelled PSF. (a1) 3D-reconstructions of a cleared fruit fly from 353 raw slices (MIP projection). Images were recorded using a 10x objective with NA = 0.3 (UPLFLN 10x, Olympus, Germany). (a2) Data from a1 after deconvolution with the measured PSF depicted in a2. (a3). Data from a1 after deconvolution with the modelled PSF depicted in a2. A comparison of a2 and a3 shows that the deconvolution results are almost identical. (a4) Mean standard deviations (MSD) measured between a1 vs. a2 (4.30 × 105 = 99.8%), a1 vs. a3 (4.31 × 105 = 100%) and a2 vs. a3 (9.33 × 104 = 21.6%). (b1) Detail of a cleared mouse embryo (dorsal root ganglia) obtained from 419 raw slices (MIP projection). Images were recorded using a 20x objective with NA = 0.45 (LUCPLFLN, Olympus, Germany). (b2) Data from b1 after deconvolution using the measured PSF depicted in b2,3). Data from b1 after deconvolution using the modelled PSF depicted in b2 (right). Visual comparison of b2 and b3 confirms that the deconvolution results are virtually identical. (b4) Mean standard deviations (MSD) measured between b1 vs. b2 (1.37 × 108 = 85.5%), b1 vs. b3 (1.61 × 108 = 100%) and b2 vs. b3 (1.52 × 106 = 0.95%).

