Figure 2.

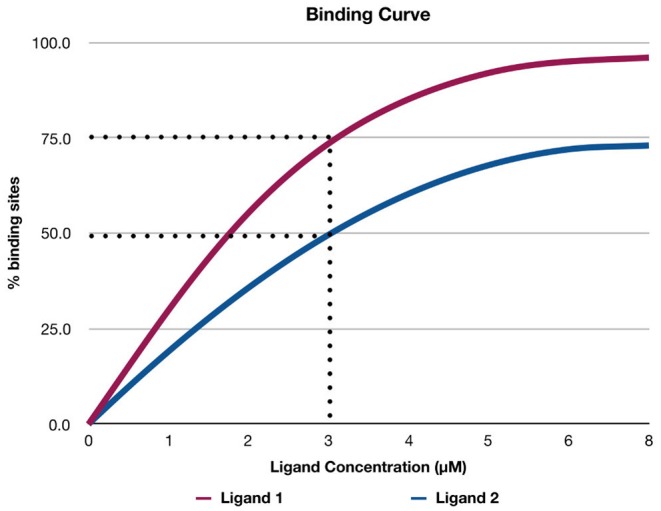
A hypothetical example of a binding curve for ligand 1 and ligand 2. The x-axis shows the concentration of the ligand, and the y-axis shows the percentage of available binding sites (Θ) in a protein that is occupied by the ligand.

A hypothetical example of a binding curve for ligand 1 and ligand 2. The x-axis shows the concentration of the ligand, and the y-axis shows the percentage of available binding sites (Θ) in a protein that is occupied by the ligand.