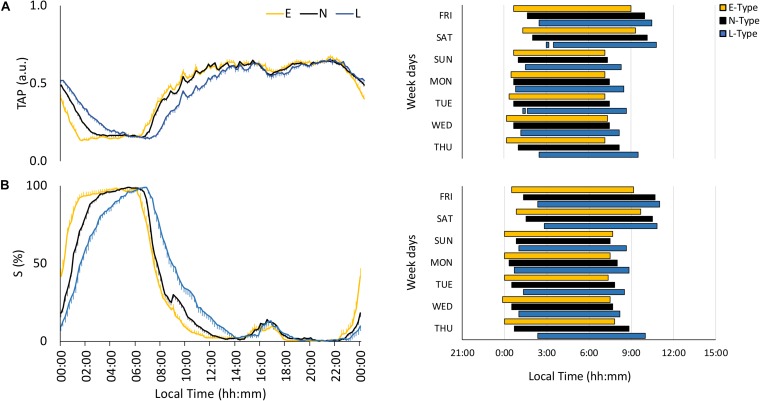
FIGURE 3.
Mean waveforms and actograms for early (E-types, in yellow; n = 20% of the total subjects), neither (N-types, in dotted black; n = 60% of the total subjects), and late-types (L-types, in blue; n = 20% of the total subjects) for: (A) TAP (total subjects = 159) and (B) sleep (S; total subjects = 148). Waveform data are expressed as mean ± SEM. TAP and sleep actograms correspond to the first and third tercile values, respectively (values corresponding to the rest phase).

