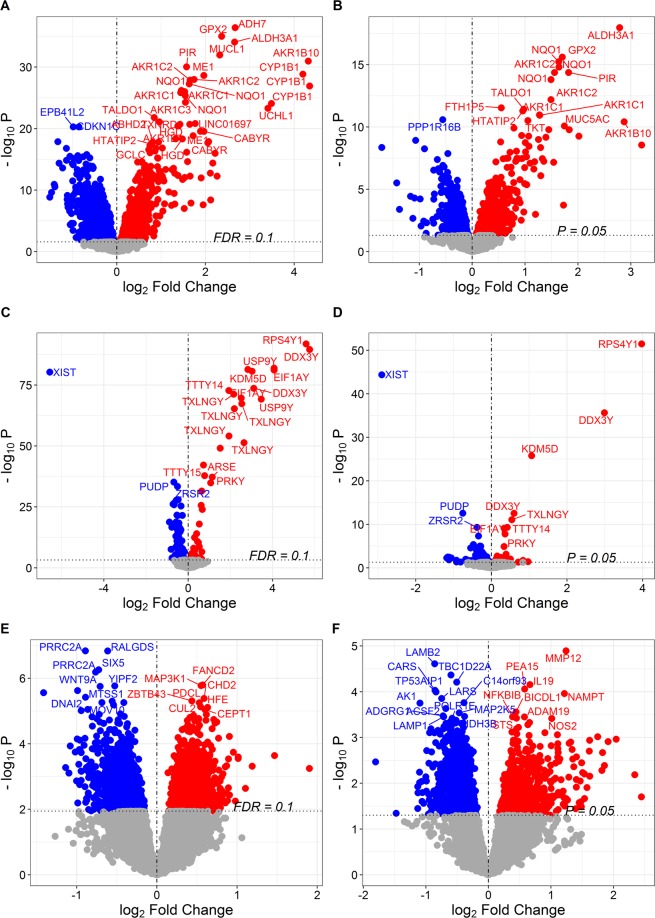
Figure 2.
Volcano plots showing probe-phenotype associations. (A) Probe associations for smoking status in the discovery set. (B) Probe associations for smoking status in the replication set. (C) Probe associations for sex in the discovery set. (D) Probe associations for sex in the replication set. (E) Probe associations for sex-by-smoking interaction in the replication set. (F) Probe associations for sex-by-smoking interaction in the discovery set. Probes shown in red were up-regulated in current smokers and probes shown in blue were down-regulated in current smokers in (A) and (B). Probes shown in red were up-regulated in males and probes shown in blue were down-regulated in males in (C) and (D). Probes shown in red exhibit a positive sex-by-smoking interaction in male current smokers while the probes shown in blue exhibit a negative sex-by-smoking interaction in male current smokers in (E) and (F).

