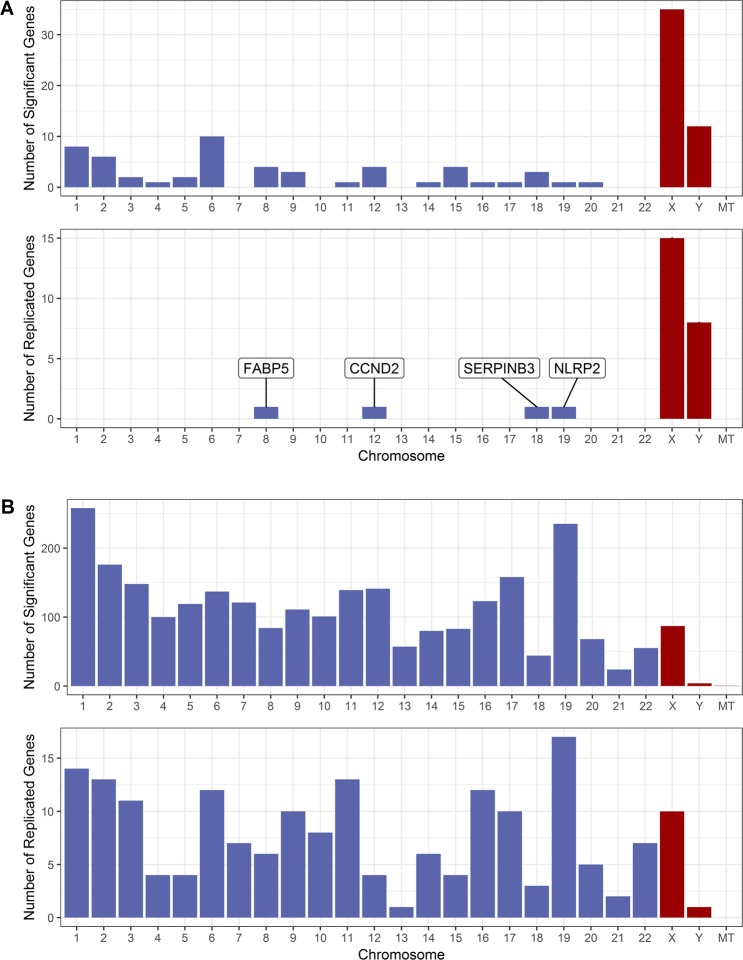
Figure 3.
Chromosome distribution of genes that were associated with sex or sex-by-smoking interaction. (A) Top: Chromosome distribution of genes associated with sex in the discovery set (FDR < 0.1). Bottom: Chromosome distribution of the replicated genes for sex. (B) Top: Chromosome distribution of genes associated with sex-by-smoking interaction in the discovery set (FDR < 0.1). Bottom: Chromosome distribution of the replicated genes for sex-by-smoking interaction. Abbreviation used in the figure: MT = mitochondrion.

