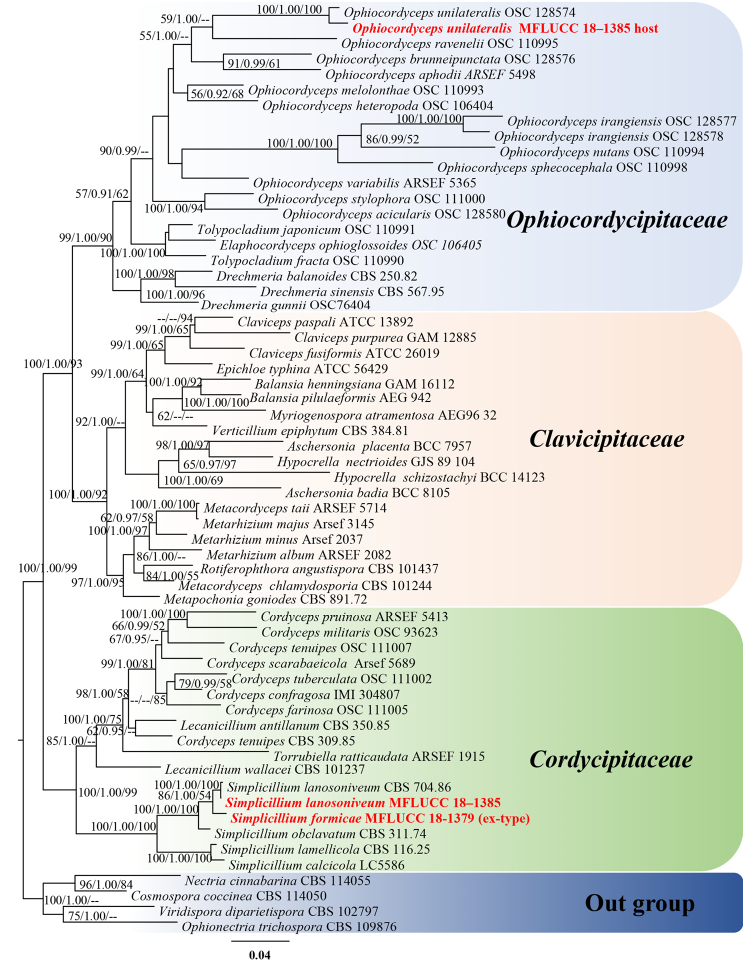
Figure 1.
Phylogram generated from maximum likelihood analysis based on combined SSU, LSU, TEF and RPB1 sequence data. Bootstrap values for maximum likelihood (ML, left) and maximum parsimony (MP, right) equal to or greater than 50% and Bayesian posterior probabilities (BYPP, middle) equal to or greater than 0.90 are placed nearby the note. The newly generated sequences are indicated in red bold.

