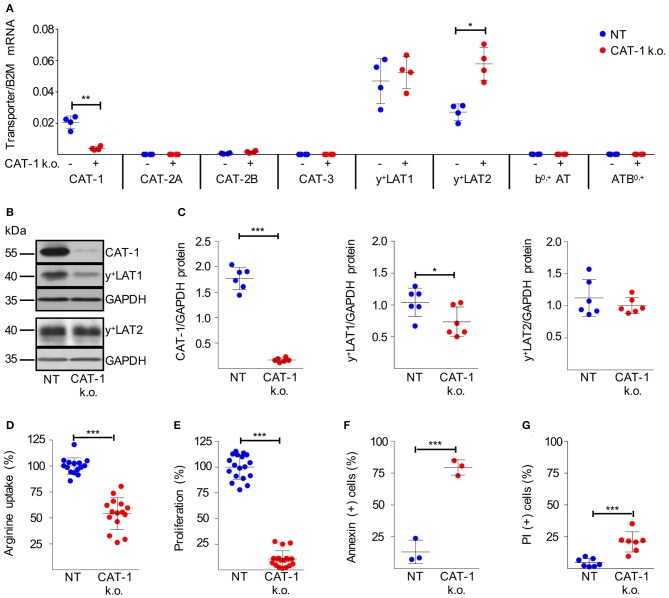
Figure 5.
Knockdown of CAT-1 in HG3 cells inhibits proliferation and viability. (A–G) HG3 cells were transduced with SLC7A1-5 (+ or CAT-1 k.o.) or non-target shRNA (- or NT) lentivirus. 48 h after transduction, cells were cultured for further 48 h with puromycin (as selecting antibiotic) in the presence of 1 mM citrulline and 67 μM lysine tripeptide to allow arginine-independent expansion of CAT-1 k.o. cells. (A) The expression of arginine transporter mRNA was quantified in relation to beta 2-Mikroglobulin (B2M) by qRT-PCR (means ± SD, n = 4). (B,C) Protein expression of CAT-1, y+LAT1, y+LAT2, and GAPDH as loading control was analyzed in HG3 cells that were treated as described above. (B) One representative Western Blot is shown of 4 independent experiments. (C) Quantitative analysis of Western Blots. Shown are the means ± SD of transporter expression in relation to GAPDH (n = 6). (D) The uptake of 100 μM [3H]arginine (10 μCi/ml) was determined over 30 s in the presence of 1 mM leucine. Arginine uptake in HG3 NT cells was set as 100% (mean: 37.88 ± 11.93 pmol/106 cells). Depicted are means ± SD values (n = 15). (E) Cell proliferation was determined by the incorporation of [3H]thymidine over 16 h (n = 18). Proliferation in NT HG3 cells (mean: 46,501 ± 23,722 cpm) was set as 100%. (F,G) Cell viability was determined by flow cytometry-based analyses of (F) Annexin V- (n = 3) and (G) PI- (n = 7) positive cells. Depicted are means ± SD values. Statistical calculations were performed by t-test.

