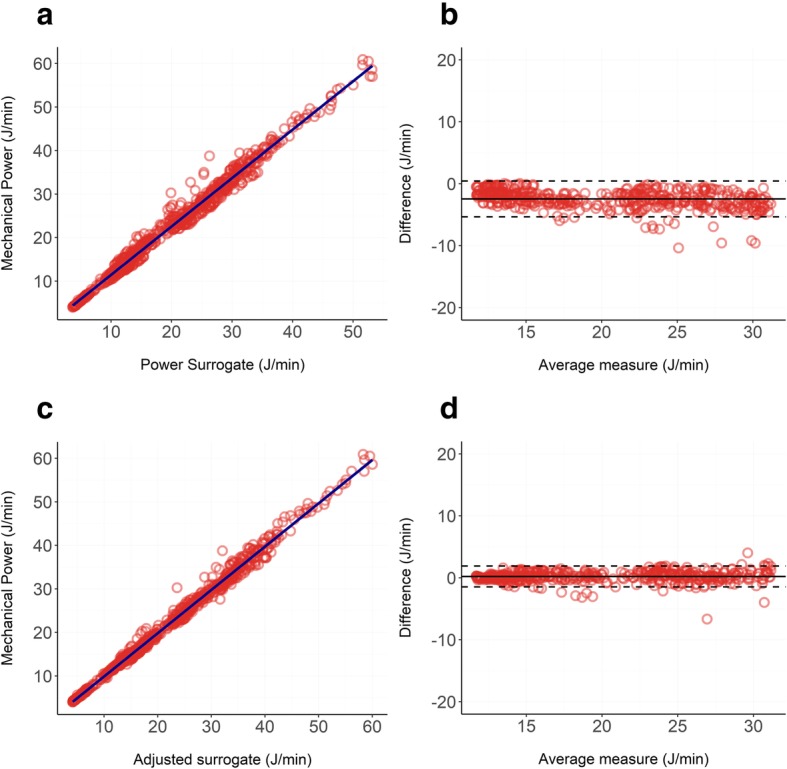
Fig. 3.

a, b: Relationship between our unadjusted surrogate of mechanical power (Eq. 3) and the reference formula (Eq. 1) in pigs: panel a shows the linear regression (R2 = 0.98), and panel b shows the Bland-Altman (bias = − 2.45 J/min; proportional error = − 0.09 J/min). c, d Relationship between our adjusted surrogate of mechanical power (Eq. 9) and the reference formula (Eq. 1) in pigs: panel c shows the linear regression (R2 = 0.99), and panel d shows the Bland-Altman (bias = 0.21 J/min; proportional error = 0.01 J/min)
