Fig. 3.

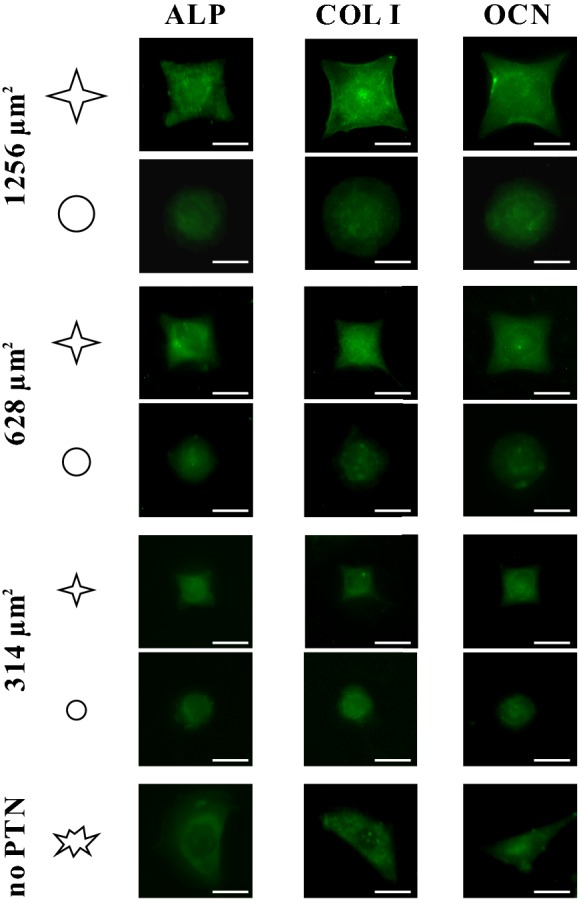
Fluorescent images showing the FITC-labeled protein expression of ALP, COL I, and OCN of individual MSCs cultured on the micropatterned regions and those on blank regions on the same slide for 3 days. Scale bar, 20 μm

Fluorescent images showing the FITC-labeled protein expression of ALP, COL I, and OCN of individual MSCs cultured on the micropatterned regions and those on blank regions on the same slide for 3 days. Scale bar, 20 μm