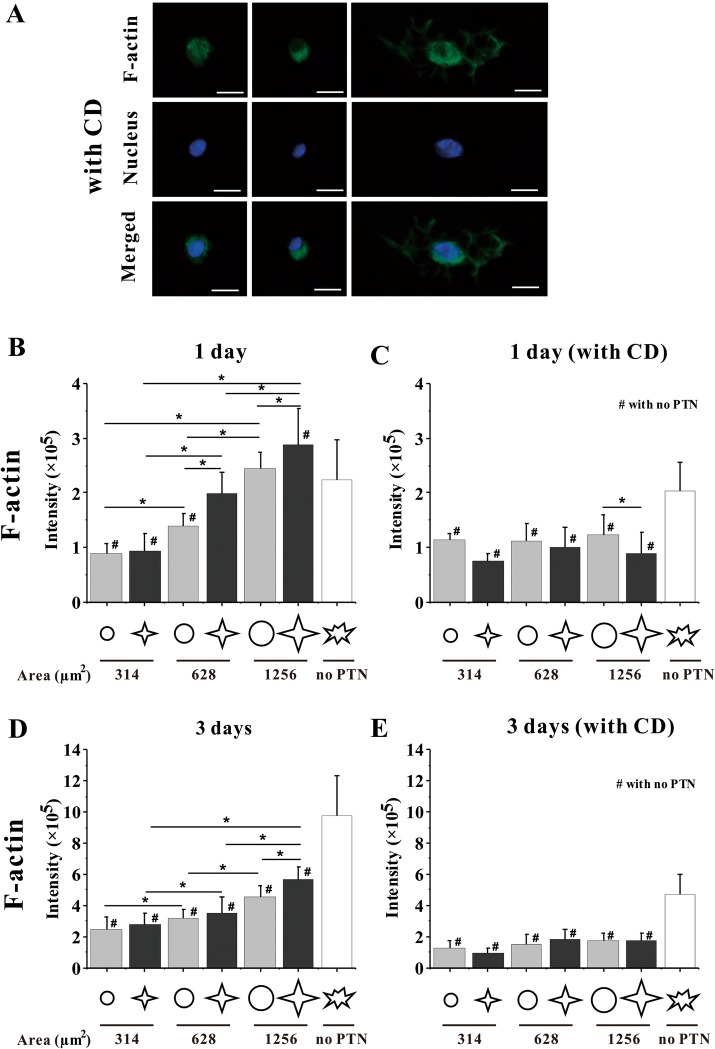
Fig. 5.
Fluorescent images and statistical analyses of F-actin. A Fluorescent images of individual MSCs stained with FITC phalloidin for F-actin and with Hoechst for nucleus at 1 days after seeding with CD. Scale bar, 20 μm. B–E The expression of F-actin in MSCs. Statistical analyses on the fluorescence intensity of F-actin in MSCs on different patterns without and with CD after 1-day seeding and 3-day seeding. *, #p < 0.05

