Fig. 4.
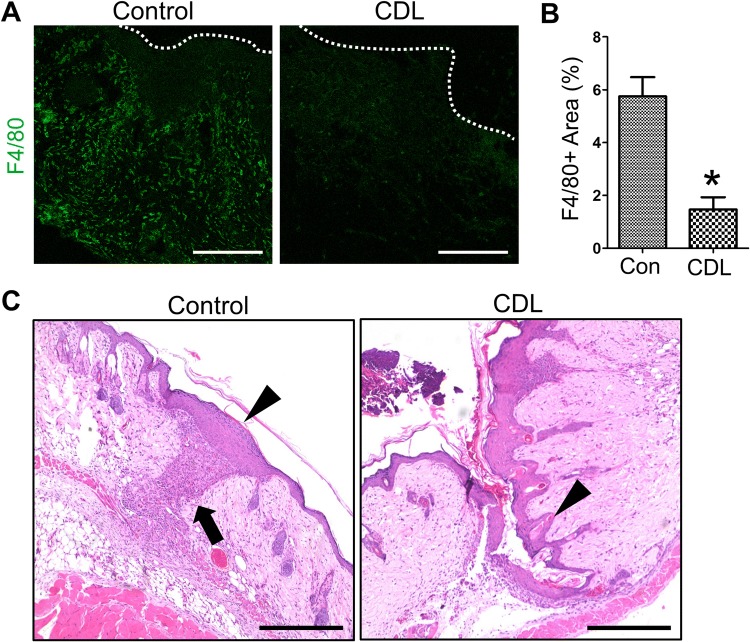
A, B Comparisons of F4/80+ macrophage distribution in flap wound between control and clodronate liposome (CDL)-injected mice. Dotted lines indicate the wound margin. Scale bars 100 µm. *p < 0.05. C Representative images showing impaired epithelial remodeling of flap margin in CDL-injected mice. The arrow indicates infiltrated macrophages at the flap margin. The arrowheads indicates remodeled epithelium at the flap margin. Scale bars 400 µm

