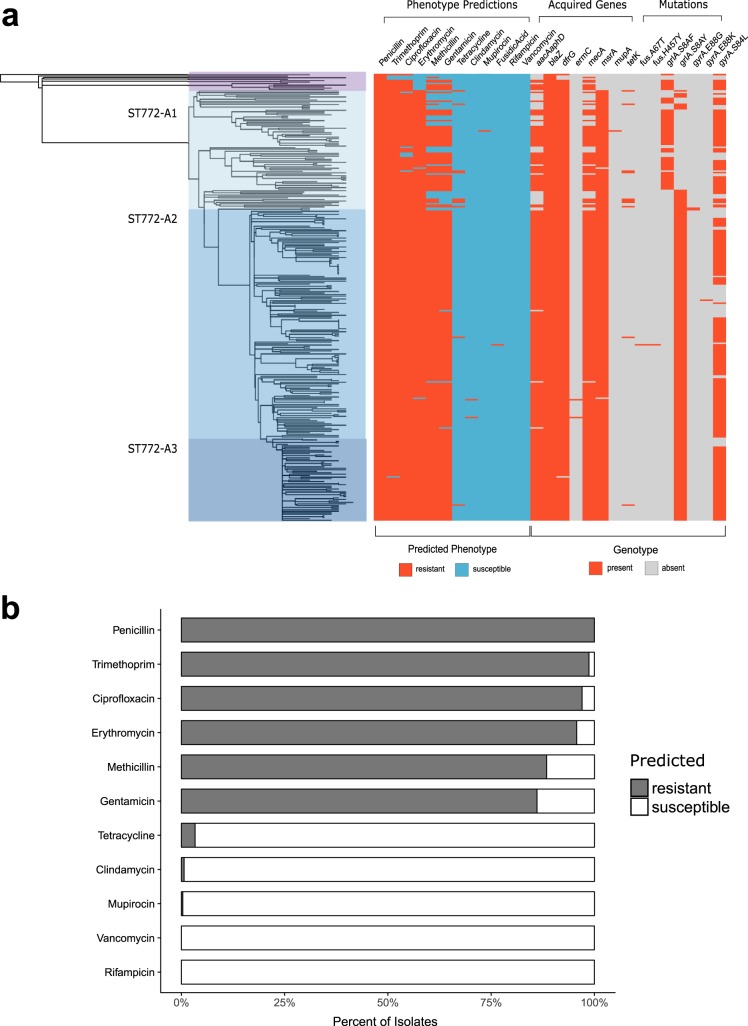
FIG 4.
Resistome and predicted resistance phenotypes across ST772. (a) Resistome mapped to maximum likelihood phylogeny of ST772. The predicted resistant phenotype is depicted in red, while the susceptible phenotype is depicted in blue. The presence of acquired resistance genes and mutations responsible for phenotype predictions is shown in red, while the absence of these determinants is shown in gray. (b) Percentages of isolates predicted resistant (gray) or susceptible (white) for all antimicrobials included in Mykrobe Predictor.

