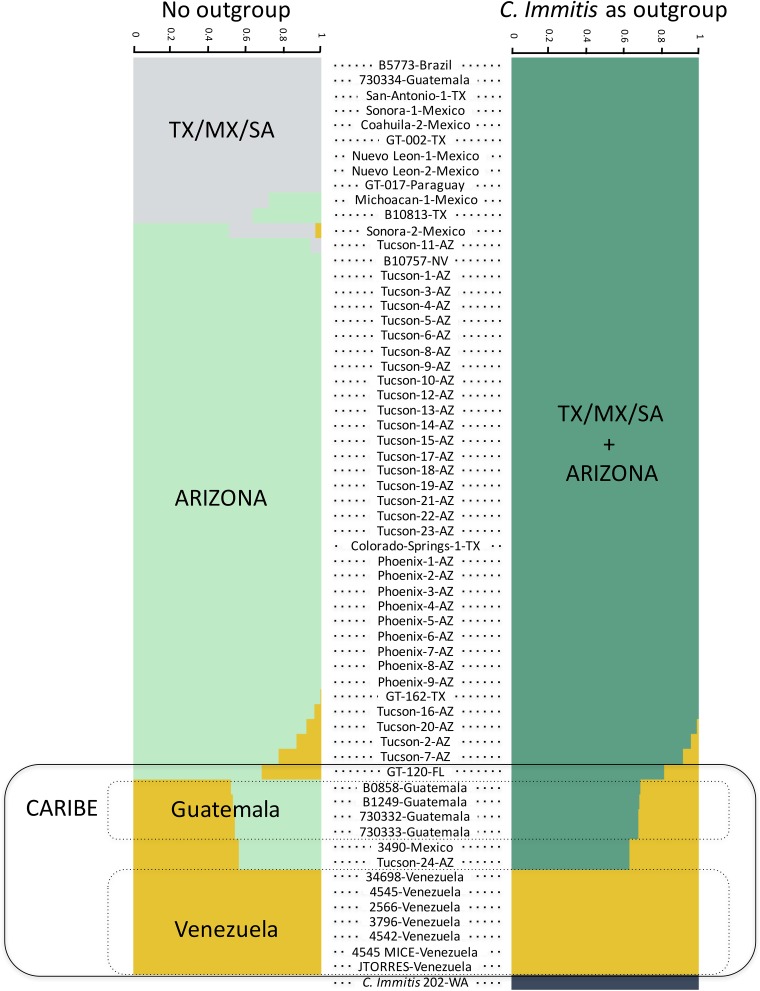
FIG 3.
Strong population structure within C. posadasii. Population structure plots based on Bayesian posterior probabilities implemented in fastSTRUCTURE. We did the analysis in two ways, first using C. immitis as an outgroup for C. posadasii or using only C. posadasii strains. Each row represents an individual. The heights and colors of percentage of each population represent the probability of belonging to a given cluster.

