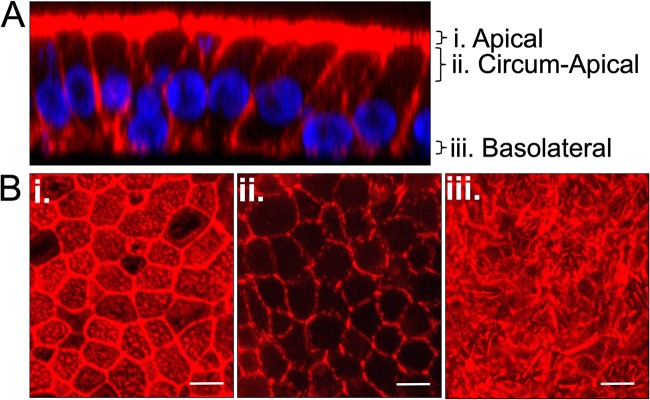
FIG 1.
F-actin network in HAE cells. HAE cells were fixed and permeabilized, and F-actin filaments were visualized by staining with phalloidin (red) and nuclei by staining with DAPI (blue). Z-stacks were acquired by confocal microscopy. (A) The vertical section (xz) view from a z-stack series is shown. (B) The planes of the corresponding en face (xy) images are indicated. The F-actin networks in apical (i), circumapical (ii), and basolateral (iii) HAE cells are shown. As indicated, the en face views are comprised of maximum-intensity projection images of three to five z-stacks. Images are representative from n = 6 samples (two technical replicates from three human donors [biological replicates]). Scale bar, 20 μm.

