FIG 2.
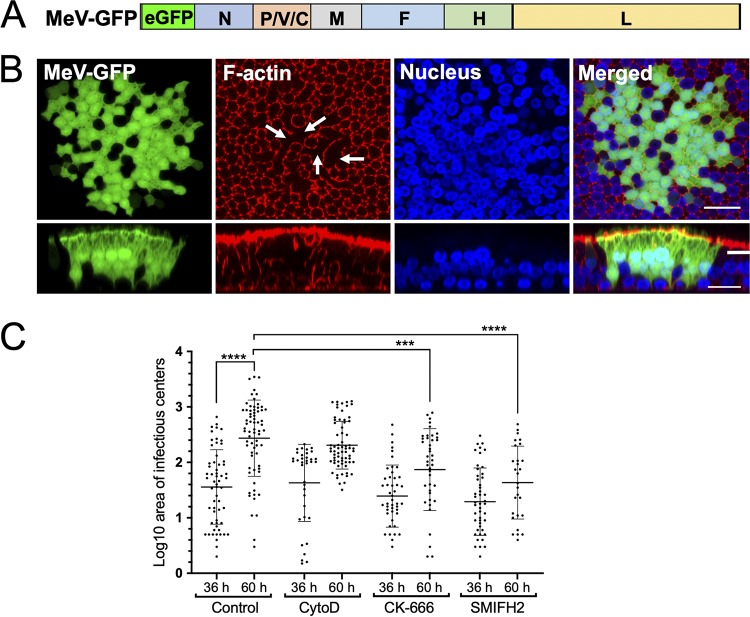
Structure of F-actin within infectious centers. (A) Schematic of the MeV-GFP genome. The eGFP coding region was inserted between the leader sequence and the N gene as a separate transcription unit. (B) HAE cells were infected with MeV-GFP (MOI = 1) and imaged using confocal microscopy 72 h later. Fixed and permeabilized HAE cells were stained for F-actin with rhodamine-conjugated phalloidin (red), and the nuclei were visualized with DAPI (blue). Both en face (upper panels) and vertical (lower panels) sections are shown. Arrows indicate the central regions of the infectious center where F-actin has disassembled. Scale bar, 20 μm. Images are representative from n = 6 samples (two technical replicates from three human donors [biological replicates]). (C) HAE cells were infected with MeV-GFP at an MOI of 1 and, 36 h later, the cultures were treated with the F-actin-disrupting agents cytochalasin D (CytoD), CK-666, or SMIFH2 or a control (DMSO) for 24 h. The areas of the infectious centers were quantified using ImageJ software at the time of drug delivery (36 h) and 24 h after drug delivery (60 h). Each dot represents the log-transformed value of the area of individual infectious centers. The data for each condition are pooled from six human donors. AU, arbitrary unit. Adjusted P value using one-way ANOVA corrected for multiple comparisons were determined (***, P < 0.001; ****, P < 0.0001).

