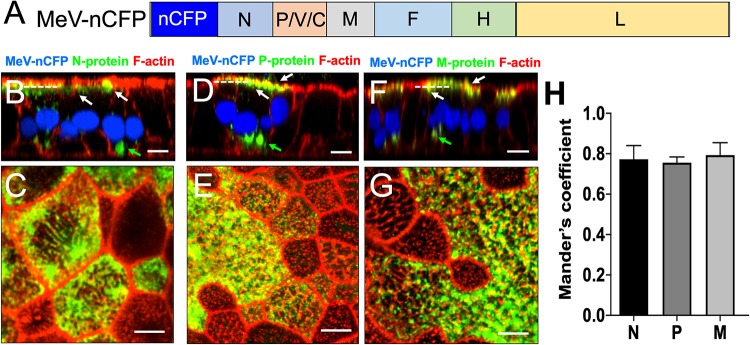
FIG 3.
Localization of MeV N, P, and M proteins within infectious centers. (A) Schematic of the MeV-nCFP genome. The coding region of nuclear-targeted cyan fluorescent protein (nCFP) was inserted between the leader sequence and the N gene as a separate transcription unit. (B to G) Images of N, P, and M protein localization. HAE cells were infected with MeV-nCFP (blue) and, at 72 hpi, the cells were fixed and immunostained for N protein (B and C), P protein (D and E), or M protein (F and G) (green). F-actin was stained with phalloidin (red). The cells were examined by confocal microscopy. White arrows indicate apical localization, and green arrows indicate perinuclear localization. Vertical sections of immunostained cultures are shown in panels B, D, and F. Scale bar, 20 μm. Cells were then examined by stimulated emission depletion (STED) superresolution microscopy (C, E, and G). En face views of immunostained cultures are shown. Scale bar, 5 μm. Dotted lines in panels B, D, and F indicate the approximate plane of view for panels C, E, and G, respectively. Images are representative from n = 9 samples (three technical replicates from three human donors [biological replicates]). (H) Quantification of colocalization between viral proteins (N, P, and M) and F-actin at the apical surface in infectious centers was measured by applying Mander’s colocalization coefficient using Coloc2 plugin in Fiji.

