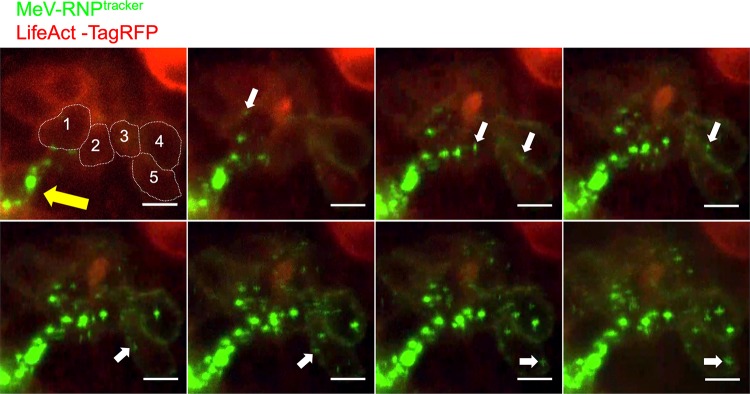
FIG 7.
Time-lapse microscopy analysis of MeV RNPs transport along the F-actin network. HAE cells were transduced with an adenoviral vector expressing LifeAct-TagRFP (red). After 24 h, HAE cells were infected with MeV-RNPtracker (green). Fluorescence was monitored by confocal time-lapse microscopy beginning at 48 h after MeV infection; the spread of MeV-RNPs is shown at approximately 2-h intervals. The yellow arrow indicates the initial infected cell. Dotted lines in the first panel indicate individual columnar epithelial cells, as well as the circumapical F-actin networks. The cells are numbered 1 to 5 from nearest to furthest from the initial infected cell. White arrows indicate the unidirectional flow of MeV RNPs. Images correspond to Video S4. Scale bars, 10 μm.

