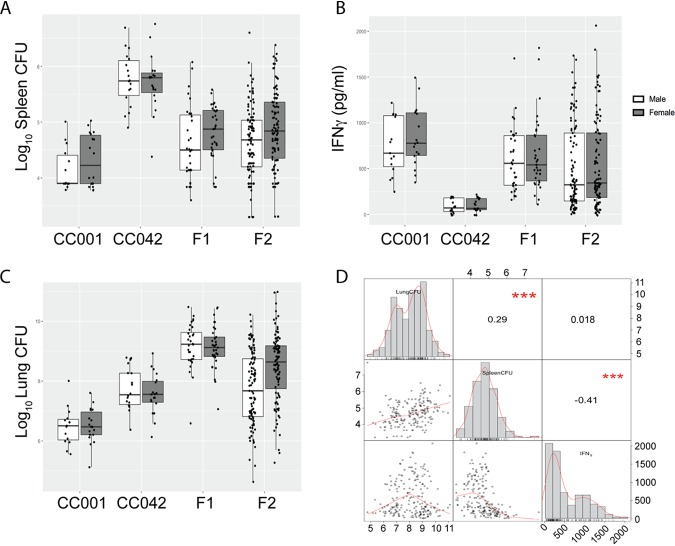
FIG 3.
TB disease traits in a (CC001 × CC042)F2 intercross population. At 28 to 31 days postinfection, the following traits were quantified in the parental strains and the F1 and F2 offspring: the numbers of spleen CFU (A), IFN-γ levels from lung homogenate (B), and the numbers of lung CFU (C). (D) The Pearson correlation between measured traits. The distribution of each measured phenotype (numbers of lung CFU, numbers of spleen CFU, and IFN-γ levels) is shown on the diagonal. Scatter plots depicting the correlation for each pair of phenotypes are shown below the diagonal. Above the diagonal, the correlation coefficient and significance are shown. ***, P < 0.001. The data shown in all panels are for the following population sizes: for the F2 population, n = 201 total mice, n = 101 females, and n = 100 males; for the F1 population, n = 65 total mice, n = 32 females, and n = 33 males; for CC001 parent mice, n = 33 total mice, n = 15 females, and n = 18 males; and for CC042 parent mice, n = 37 total mice, n = 18 females, and n = 19 males. The mice were infected in 4 batches, and values were adjusted for batch differences using coefficients from multiple regressions.

