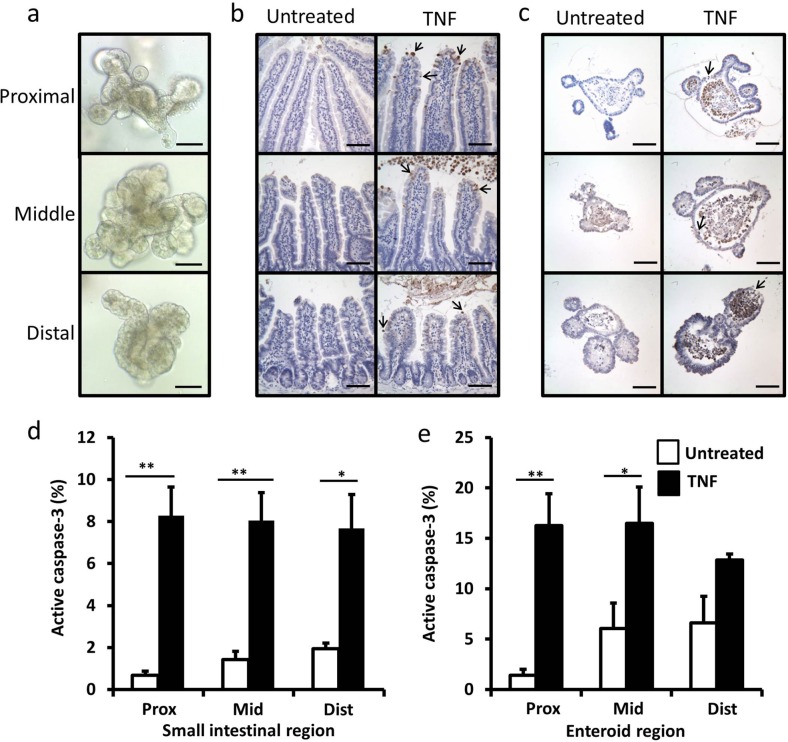
Fig. 1. Enteroids show regional differences in morphology and respond to TNF similarly to native SI tissue.
Bright field micrographs of enteroids derived from proximal, middle and distal sections of C57BL/6J SI (a). Proximal, middle and distal sections of SI tissue taken from untreated and TNF (0.33 mg/kg, 1.5 h) treated C57BL/6J mice (b) and enteroids generated from proximal, middle and distal regions of SI untreated or treated with TNF (100 ng/mL 24 h) (c) immunohistochemically stained for active caspase-3. Quantification of active caspase-3 positive epithelial cells from untreated (white) and TNF treated (black) SI epithelia (d) and enteroid culture (e). For animal study, quantified from n = 6 mice per group; for enteroid study n = 6, N = 3, *p < 0.05, **p < 0.01. Scale bars = 100 µm.

