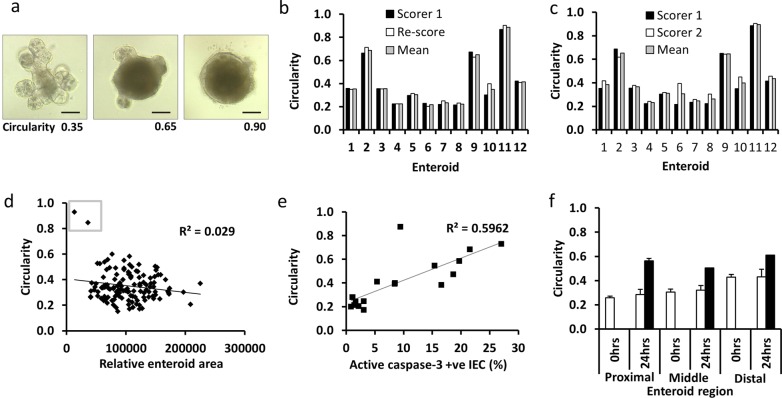
Fig. 3. Validation of circularity assessment as a marker of TNF-induced apoptosis in enteroid culture.
Light micrograph examples of proximal tissue-derived enteroids either untreated 3 days post passage (left), 48 h following 100 ng/ml TNF (middle) and 48 h following treatment with CM from LPS-activated BMDCs (right) traced in yellow using Image J (a). Quantification of circularity from 12 different enteroids administered with a range of treatments over different experiments and re-scored by the same observer (b) and by an independent second observer (c). Correlation between relative enteroid area and circularity for 130 individual enteroids at baseline (d), small organoids at baseline have high circularity values and need to be excluded from further analysis (grey box). Percentage active-caspase 3 positive cells were correlated with enteroid circularity from organoids selected at 0, 24 and 48 h post treatment with 100 ng/ml TNF (e). Change in circularity between three enteroid regions at baseline (white bars) and 24 h after 100 ng/ml TNF (black bars). Scale bars = 100 µm.

