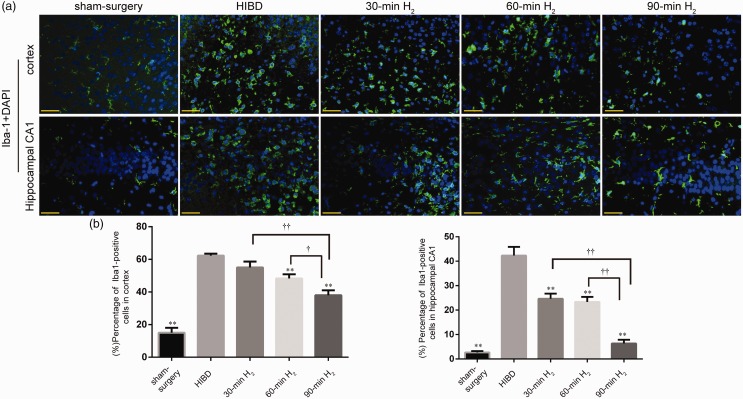
Figure 2.
Microglial activation changes following H2 inhalation in rats with HIBD. (a) Representative immunofluorescence staining Iba-1 (green, activated microglia) and DAPI (blue, all nuclei) in the left frontal and parietal cortex and hippocampal CA1 region of rats in sham-surgery, HIBD, 30-min H2, 60-min H2, and 90-min H2 groups at 72 h after surgery. Scale bar = 50μm. (b) Differences in the percentage of Iba-1-positive cells in the cortex and hippocampal CA1 between groups. n = 4 per group. **P < 0.01 vs. HIBD group, ††P < 0.01, †P < 0.05.

