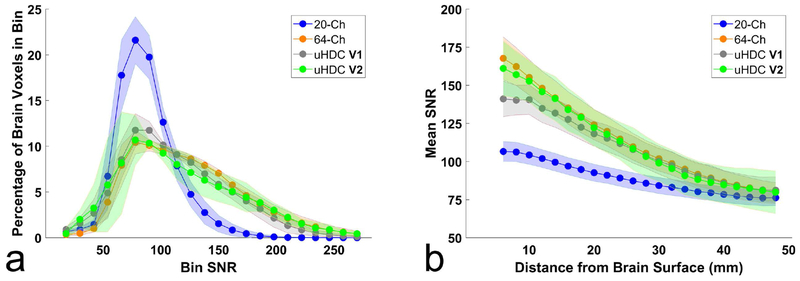
Figure 7:
Histogram analysis of the SNR data of each receive configuration. (a) the percentage of voxels within the brain that fall within each SNR bin. In (b), brain voxels have been grouped by the distance from the surface of the brain, and the mean SNR in each distance bin is displayed. In both plots, the 20-Ch Coil with uHDC helmet (V1 and V2 configurations) performed slightly below the 64-Ch coil. Values and shaded error bars represent mean SNR and standard deviation amongst subjects.

