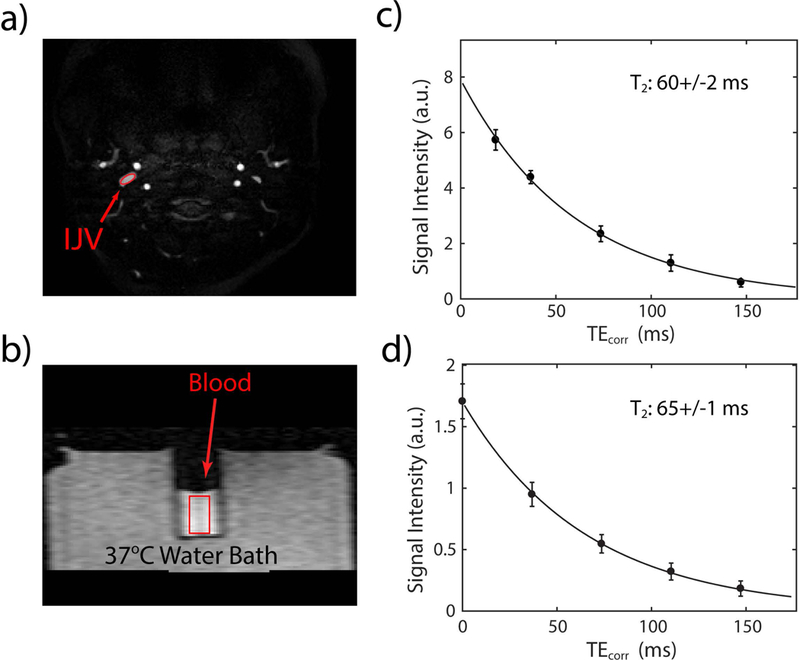
Figure 1.

In vivo and in vitro experiments to determine blood T2 for one SCA participant. A representative image at the shortest TEcorr (a) in a slice through the IJV and (b) on a blood sample drawn from the same participant. The average intensities of each ROI (red) were fitted as a function of TEcorr using a single exponential decay function, I = A×exp(−TEcorr/T2), for the in vivo (c) and in vitro (d) experiments.
