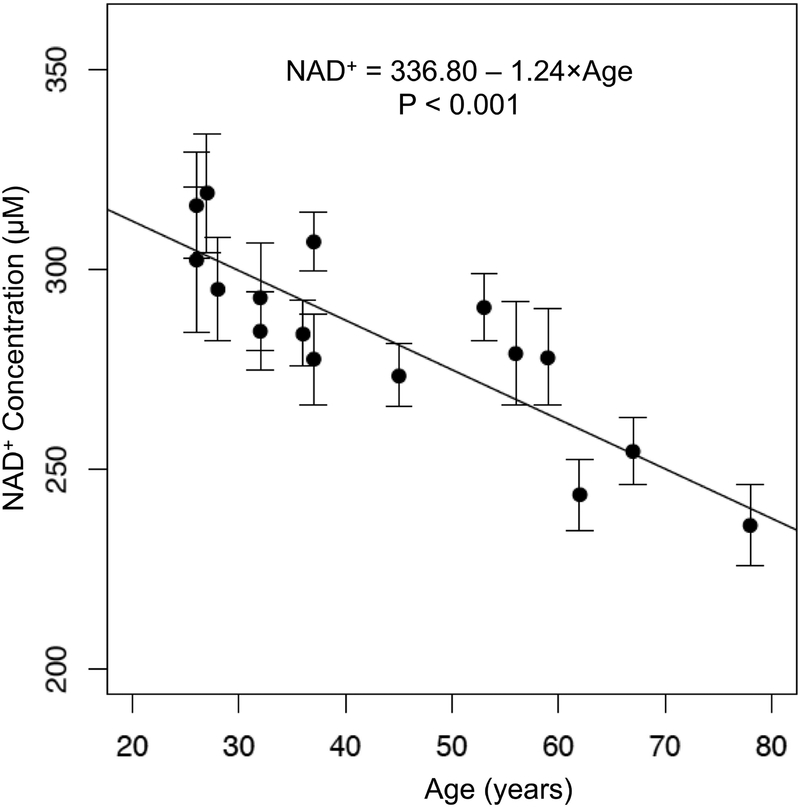
Figure 5.
Decline of cerebral NAD+ with aging. Individual NAD+ levels measured from the occipital cortex of healthy volunteers plotted against the age showing a linear decrease of NAD+ level with healthy aging. Filled circles represent within-subject means and error bars depict ± one standard error. Standard error was calculated as the within-subject standard deviation divided by the square root of the number of measurements for that subject

