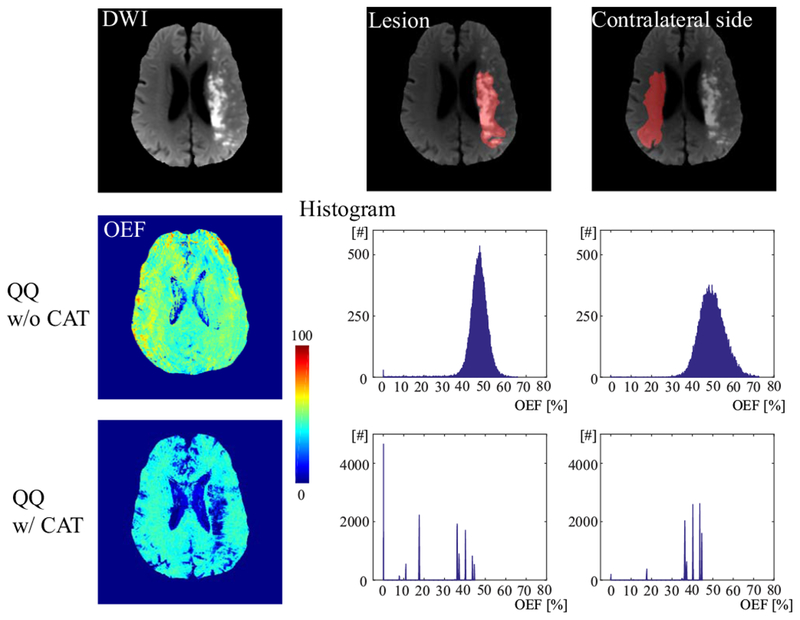
Figure 5.

The histogram of OEF values in the lesion and its contralateral side in a second stroke patient imaged 12 days post stroke onset. QQ with CAT shows a different distribution in the lesion as compared to mirror side. The lesion shows 8 peaks with the strongest two peaks at 0 and 17.5%, while the contralateral side has 6 peaks with dominant peaks at 35 ~ 45%. However, QQ without CAT does not have a distribution specific to low OEF values in the lesion, but there are bell-shaped distributions for both the lesion and contralateral side (broader in the contralateral side) with peaks at 47% and 49%, respectively.
