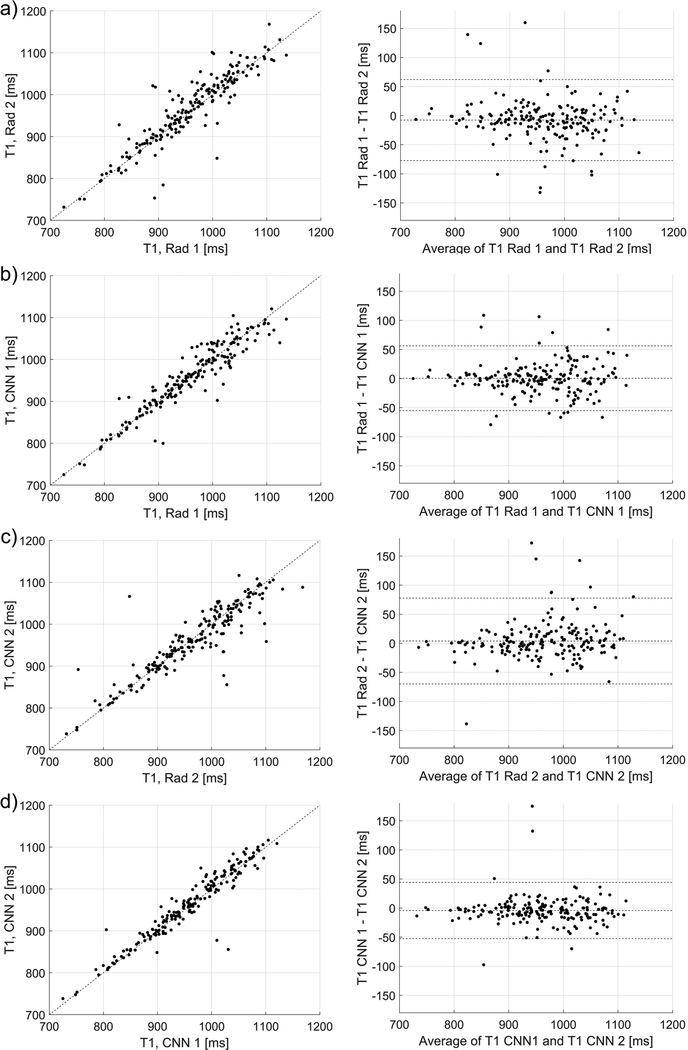
Figure 3.
The relationships and Bland-Altman plots for the average T1 values calculated using the manual and automatic segmentations provided by the radiologists and the CNNs, a) relationship for the radiologists’ ROIs (linear correlation coefficient of 0.91, p-value<0.001), b) relationship between the CNN1 and CNN2 (0.95, p-value<0.001). c) and d) show the corresponding relationships for the CNN 1 (0.94, p-value<0.001) and CNN 2 (0.90, p-value<0.001) in respect to the radiologists’ ROIs, which were used to develop the models.

